
Layer 7 Load Balancer distributing HTTP(s) requests.
Amazon Web Services (AWS) Application Load Balancer ( ALB) is a powerful tool for managing incoming traffic to your applications. Downtime of your application behind an ALB can lead to revenue loss, customer dissatisfaction, operational disruptions and can even lead to brand reputation damage. When issues arise, effective troubleshooting is crucial to maintaining optimal performance and availability.
In this article, we’ll explore best practices for troubleshooting Application Load Balancer to ensure you’re handling problems efficiently and effectively.
Scope
AWS ALBs offers a wide array of features, each requiring specific troubleshooting methodologies. While this article cannot cover every feature in detail, I plan to address them in dedicated blog posts in the future. For now, I will focus on the most common issues I have encountered while assisting customers.
- Connectivity Issues.
- HTTP-Related Errors.
- Unexpected Latency.
This blog post aims to guide you in the right direction, encouraging you to explore the problem from various angles and delve deeper to uncover its root cause.
By leveraging basic tools and knowledge, you can build a robust troubleshooting strategy for advanced ALB features like user authentication, gRPC, and session stickiness.
Let’s jump right in
Structured troubleshooting is crucial for finding the root cause of a problem, as it provides a systematic approach to identifying, analysing, and resolving issues efficiently. Let’s tackle these issues one by one:
Connectivity Issues
TCP connection timeout.
Clients might experience complete inaccessibility of your application behind ALB. In such cases, the troubleshooting focus should be on the frontend connection. Let me first explain the difference between frontend and backend connections:
Frontend connections refer to how clients interact with the ALB. Clients, such as browsers and applications after resolving the ALB DNS to IP addresses, send requests to the ALB. Listeners on the ALB handle the incoming requests using specified protocols and ports.
Backend connections refer to how the ALB routes traffic to your applications. The ALB forwards requests to target groups, which can include EC2 instances, containers, or IP addresses. It performs health checks to ensure that targets are healthy and capable of handling requests, then distributes incoming traffic evenly across these healthy targets.
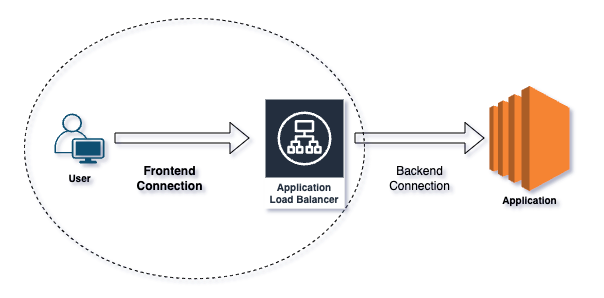
Frontend vs Backend connection.
- Ask the right questions : TCP timeout or reset?
A timeout means that the ALB either never received your request or never sent a response back, while a reset means that the ALB responded, but in an unexpected way.
Ever heard “I can’t connect”? — To understand connectivity issues, start by running curl or telnet on the listener port and interpret the output. Alternatively, use tools like Postman or directly access the application URL in a browser.
Connection resets can occur due to attempts on the wrong listener port or client-side firewall settings.
Potential causes of connection timeouts include an internet-facing ALB placed in a private subnet, routing problems between clients and ALB subnets, or restrictions imposed by AWS Network ACLs/Security Groups.
For SSL handshake errors, utilise OpenSSL and Curl commands to pinpoint issues, and monitor the ClientTLSNegotiationErrorCount CloudWatch metric for increases, indicating cipher mismatches or client certificate verification failures.
openssl s_client -connect
: curl -iv https://server:port
- Intermittent or always : Determine if the issue is intermittent or persistent by resolving the ALB DNS and testing connections to its IPs.
- Remember the fundamentals : Security Groups, Network ACLs, and Route Tables can cause timeouts. Ensure that all ALB subnets have appropriate Internet gateway routes for internet-facing deployments, or correct routing for internal load balancers based on user location (Direct Connect, Transit Gateway, VPNs).
- Logging and monitoring : TCP/SSL errors are not logged in the access logs but are captured in VPC flow logs and connection logs.
- Few users or all : Consider whether issues affect all users or only specific locations; problems may stem from a client’s internal network or ISP routing issues.
- ALB not suitable for long lived connections: ALB is provisioned, managed and maintained by AWS. ALB IPs are dynamic and they do change time to time. It can happen if ALB needs to scale to meet the demand or if the underlying host on which ALB software is deployed goes faulty. As a result, ALB changes the hardware and networking configuration to recover from failures. Long running connections will eventually break. Consider NLB for this use case.
- Clients respecting DNS TTL: Now that we know that ALB can change its IP addresses, clients connecting to the ALB should respect/re-resolve the DNS to fetch the latest values. If clients keep the DNS entry cached for long time or have IPs hardcoded, one day the connection will break.
HTTP-Related Errors
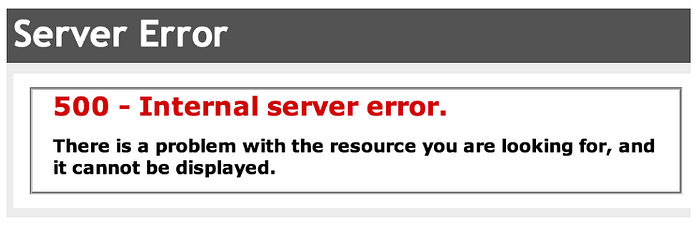
Application responding with an HTTP 500 error code.
HTTP errors, such as 4xx and 5xx status codes, indicate problems with either the client requests or server responses. For a complete list of HTTP error responses, refer to the link here. In general,
- 4xx Errors: Client-side issues like bad requests or unauthorised access.
- 5xx Errors: Server-side issues such as application crashes or misconfigurations.
It can get a bit challenging when you have a middle-man like ALB proxying the client side requests to backend application.
The first step is to identify the specific HTTP error the user is reporting. Often, this information is visible in the client-side browser or application. However, in cases where it’s not immediately apparent, developer tools can be used to uncover the error code. For mobile applications, where client-side debugging options are limited, checking the elb_status_code in the ALB access logs provides precise details about the error encountered.
The next most important troubleshooting step is to isolate the source of the error — determining whether it originates from the ALB or the backend itself.
To identify HTTP error response codes generated by the target, check for increments in the HTTPCode_Target_4XX_Count and HTTPCode_Target_5XX_Count CloudWatch metrics. If the error originated from the ALB, you will see increments in the HTTPCode_ELB_4XX_Count and HTTPCode_ELB_5XX_Count metrics. For a more detailed analysis, examine the access log entries for elb_status_code and target_status_code to determine the exact error code.
Scenario 1: If both
elb_status_codeandtarget_status_codecontain error codes and they match, the HTTP error response originated from the target, and the ALB simply relayed the error to the user.Scenario 2: If
elb_status_codecontains an error code buttarget_status_codeis set to "-", the HTTP error response originated from the ALB, indicating that the target did not respond with an HTTP error code.
http 2024-04-15T13:52:50.757968Z app/my-ALB/dc6cc9188 192.168.145.39:2347 10.0.0.1:80 -1 -1 -1 502 - 94 326 "GET http://example.com:80 HTTP/1.1" "curl/7.51.0" - - arn:aws:elasticloadbalancing:us-east-1:123456789012:targetgroup/my-targets/73e2d6bc24d8a067 "Root=1-58337262-36d228ad5d99923122bbe354"
In the access log above, the elb_status_code is set to 502 and the target_status_code is "-". Additionally, the request_processing_time, target_processing_time, and response_processing_time fields are all set to -1. This means that the load balancer couldn’t establish a TCP connection or complete an SSL handshake with its registered target, resulting in the ALB generating a 502 error.
The point I want to emphasise is that even though the HTTP error code appears to be sourced from the ALB, the underlying issue actually lies elsewhere.
For a complete list of errors generated by the ALB and their possible causes, refer the link here. While we can’t cover every HTTP error code in this post, it’s important to highlight HTTP 502 and HTTP 504 errors sourced by the ALB, as these are among the most common issues I’ve encountered while assisting customers.
Isolate all the possible ALB generated HTTP 502 scenarios : https://repost.aws/knowledge-center/elb-alb-troubleshoot-502-errors
Isolate all the possible ALB generated HTTP 504 scenarios : https://repost.aws/knowledge-center/504-error-alb
Backend resource utilisation, web server configuration, and external dependencies play significant roles that might lead to intermittent or consistent 502/504 errors. This AWS post lists some useful commands to analyse and debug backend health.
Regardless of who generates the HTTP error, you might want to trace the requests end to end. Logging X-Amzn-Trace-Id allows you to trace requests through your ALB and web servers. By comparing the unique header in both ALB and backend access logs, you gain complete visibility on every request handled by the ALB.
Finally, always remember to ask yourself the right questions: Is the error affecting a single user or many? Is it intermittent or consistent? Is there an error pattern? Does it involve a specific URI/host or multiple? Is it happening on a single target or multiple targets?
Unexpected Latency
Latency is the time taken by application to respond to user requests. High latency can severely affect the performance and user experience of your application.
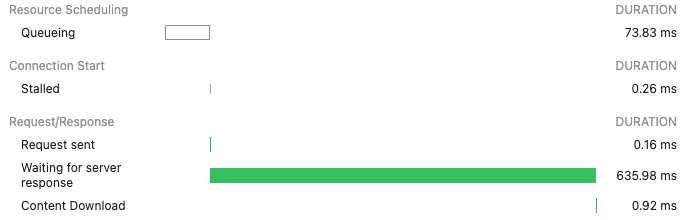
Browser’s developer tools network section showing different connection timers.
When troubleshooting latency issues, it’s important to determine whether the problem lies at Layer 3/4 (TCP/IP) or Layer 7 (Application), and whether it is caused by the ALB or the backend application.
The following command sends HTTP requests to a backend server at http://backendip:port, discards the responses, and prints various timing metrics and the HTTP status code for each request. This helps in measuring the performance and health of the application by providing details about connection time, redirection time, and overall request duration. Run the command separately against the backend servers and the ALB domain to identify any timing anomalies.
for ((i = 1; i <= 10; i++)); do curl -w "http_code:%{http_code}\t time_connect=%{time_connect}\t time_redirect=%{time_redirect}\t time_pretransfer=%{time_pretransfer}\t time_starttransfer=%{time_starttransfer}\t time_total=%{time_total}\n\n" -o /dev/null -k -s http://backendip:port -o /dev/null ; done
ALB or Backend : The TargetResponseTime CloudWatch metric measures the time from when an HTTP request leaves the load balancer until a response is received from the target. This metric indicates backend latency. If you observe spikes in the average or maximum statistics, the unexpected latency is likely caused by the backend.
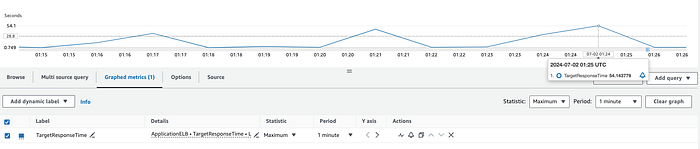
Unoptimised backend responding to the HTTP request after ~54 seconds.
To further investigate the processing time for individual requests, examine the request_processing_time and target_processing_time from ALB access logs, as well as the backend processing time recorded in the web server logs.
request_processing_time — the time from when the load balancer received the request from client until it sent the request to a target.
target_processing_time — the time from when the load balancer sent the request to a target until the target started sending the response headers.
Analysing these metrics will help you pinpoint where latency issues are occurring.
Ideally, the response time logged on the backend (backend processing time) should be equivalent to the target_processing_time. If not, the difference represents the network latency between the ALB and the backend. As mentioned previously, high target_processing_time could indicate an overloaded or unoptimised backend, or issues with external dependencies.
On the other hand, a high request_processing_time points to issues with the ALB itself. Consider the latency that may be introduced by backchannel requests to AWS WAF and identity providers when performing user authentication on the ALB.
Summary
This blog post explores best practices for troubleshooting AWS ALBs, focusing on common issues like connectivity problems, HTTP-related errors, and unexpected latency. It emphasises a structured approach, alongside command line utilities and native AWS observability tools, to isolate and identify the root causes of these issues. Future posts will delve into specific ALB features and their troubleshooting methodologies.
If you’d like to know more or are interested in our services, don’t hesitate to get in touch. You can contact us here.