
For any Kubernetes administrator, understanding the health and performance of your clusters is crucial. Fortunately, Google Kubernetes Engine (GKE) offers built-in capabilities to gather valuable metrics from cAdvisor and Kubelet, providing insights into your containerized workloads. This blog post explores how to leverage these metrics with GKE to gain a deeper understanding of your cluster’s inner workings.
What are cAdvisor and Kubelet Metrics?
cAdvisor and Kubelet are essential components within the Kubernetes ecosystem. cAdvisor continuously monitors resource utilization within containers, such as CPU, memory, and network usage. Kubelet, on the other hand, manages the lifecycle of containers within a pod. The combined metrics from these components provide a comprehensive view of your cluster’s resource consumption and container health.
Why Monitor cAdvisor/Kubelet Metrics with GKE?
By enabling cAdvisor/Kubelet metrics collection in GKE, you gain several advantages:
- Enhanced Cluster Visibility: Gain deeper insights into resource utilization across your pods, allowing for better resource allocation and optimization.
- Improved Troubleshooting: Identify bottlenecks or anomalies within your containerized workloads, facilitating faster troubleshooting and issue resolution.
- Proactive Capacity Planning: Analyze historical and current resource usage patterns to proactively anticipate future scaling needs.
Is it a managed service on GKE?
As of today, yes! Starting from GKE version GKE 1.29.3-gke.1093000, now you have an option to collect metrics from kubelet and cAdvisor in a managed way, so you only need to set enable in your cluster running on this version or later.
What about previous Kubernetes versions?
If you are still not on 1.29.3-gke.1093000 GKE version you still can collect this metric however you need to set this manually.
You will need to enable the scraping on the OperatorConfig object including the fields collection.kubeletScraping.interval
kubectl -n gmp-public edit operatorconfig config

apiVersion: monitoring.googleapis.com/v1
kind: OperatorConfig
metadata:
  namespace: gmp-public
  name: config
collection:
  kubeletScraping:
    interval: 30s
apiVersion: monitoring.googleapis.com/v1
kind: OperatorConfig
metadata:
  namespace: gmp-public
  name: config
collection:
  kubeletScraping:
    interval: 30s
More details here.
Warning: If you are already ingesting cAdvisor/Kubelet metrics into Google Cloud Managed Service for Prometheus, then you must stop ingesting those metrics before enabling managed cAdvisor/Kubelet metrics, otherwise you might end up with duplicate or incorrect metrics.
Unlocking managed cAdvisor/Kubelet Metrics in GKE
Here’s what you need to know:
- Compatibility: This feature is currently available for GKE clusters running version 1.29.3-gke.109300 or later.
- Enabling Metrics Collection: You can enable cAdvisor/Kubelet metric collection through the Google Cloud console, gcloud CLI, or Terraform. The process involves activating the Google Kubernetes Engine API and selecting the specific cAdvisor/Kubelet components you want to monitor. You can also edit your cloud monitoring configuration and include cAdvisor and kubelet metrics
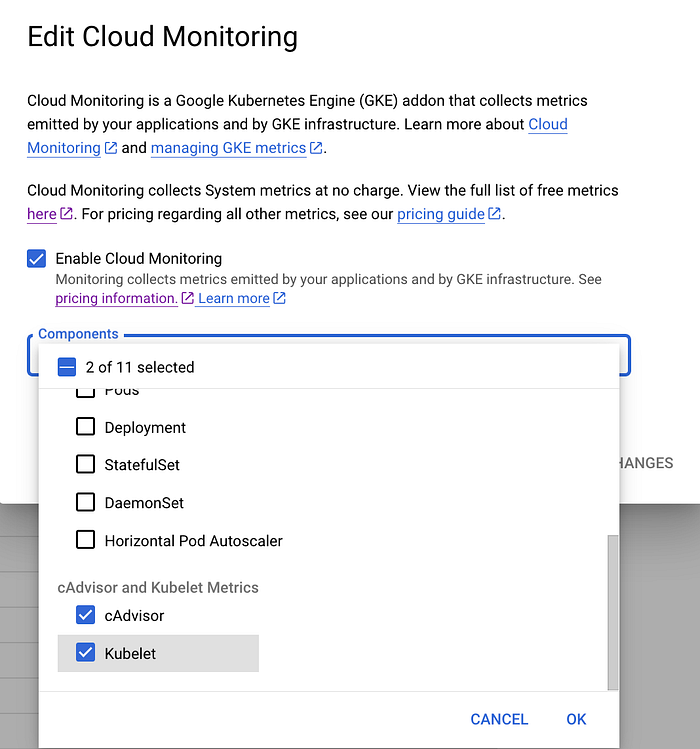
GKE Edit Cloud Monitoring
- Viewing Metrics: Once enabled, metrics are collected by Google Cloud Managed Service for Prometheus and can be queried using either PromQL or MQL. You can see several target on the Metrics Explorer on Google Cloud
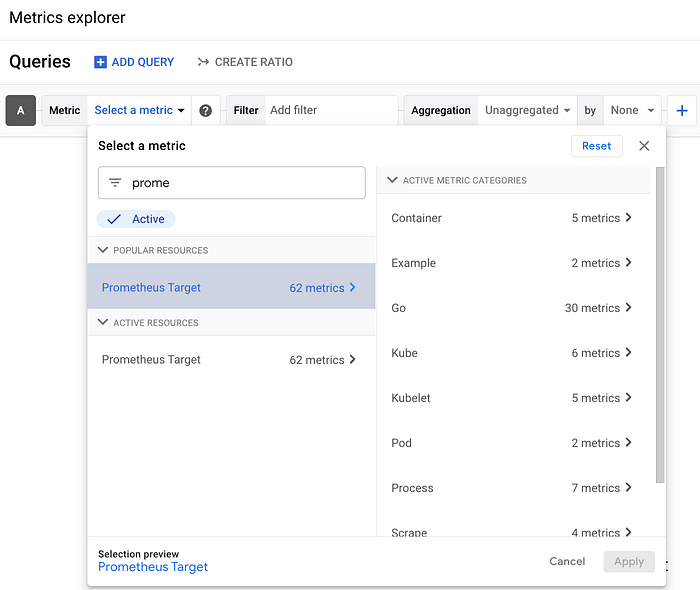
Google Cloud Metrics Explorer
One quite useful metric is the container_cpu_usage_seconds_total that can help us check the container CPU usage so we can set the CPU requests and limits accordingly without using VPA as recommender, ie:

GCP Metrics explorer: container_cpu_usage_seconds_total
By leveraging cAdvisor/Kubelet metrics in GKE, you gain a deeper understanding of your cluster’s resource utilization. This valuable data empowers you to optimize performance, identify potential issues, and ensure the efficient operation of your containerized applications. Not with GKE Managed cAdvisor and Kubelet metrics it is much simpler.
Resources:
https://cloud.google.com/stackdriver/docs/managed-prometheus/exporters/kubelet-cadvisor
https://github.com/google/cadvisor
https://cloud.google.com/kubernetes-engine/docs/release-notes-new-features#June_07_2024
https://cloud.google.com/stackdriver/docs/managed-prometheus
If you don’t know DoiT International yet you should definitely check us out. Here, our team is ready to learn more about you and your cloud engineering needs. Staffed exclusively with senior engineering talent, we specialise in providing advanced cloud consulting architectural design and debugging advice. Get in touch, and let’s chat!