
Executive summary Insurance workloads require identity-centric controls, iron-clad data isolation, and auditable telemetry. Build on Microsoft Entra ID as the single identity control plane; host core managed services on Azure using private endpoints; Use CNCF building blocks (OpenTelemetry, Linkerd/Envoy, Prometheus + Thanos, Argo CD) for deterministic security, observability, and GitOps. Automate CIS and HIPAA controls in code and CI/CD.
The problem
- Insurance systems ingest PHI and PII at scale — every misconfiguration is a compliance incident.
- Multi-cloud increases attack surface and complicates identity, telemetry, and audit trails.
- SRE/DevOps needs repeatable, auditable patterns that satisfy CIS Benchmarks and HIPAA while enabling fast delivery.
Design principles
- Identity is the perimeter — every request authenticated/authorized via Entra.
- Private by default — private endpoints, no public management planes.
- Least privilege + JIT — PIM for human elevation, short-lived service credentials.
- Service ownership (DDD) — nano-services own data stores; boundaries = audit boundaries.
- Observability as evidence — traces + metrics + immutable logs = compliance artifacts.
- Automate compliance — policy as code baked into pipelines and runtime admission.
Securing Nano-services with Entra ID
While the “Identity Control Plane” section covers federating Entra for human administrative access (like AWS SSO), a different pattern is used to secure the nano-service APIs themselves.
This architecture utilizes token-based authentication (OAuth 2.0/ OIDC), with Entra ID serving as the central Identity Provider (IdP).
The Flow:
- Client Authentication: A user logs in to the front-end application, which redirects them to Entra ID. After a successful login (with MFA), Entra ID issues a signed Access Token. For service-to-service communication, services use their own identity (a Service Principal) to get a token.
- API Call: The client (browser or service) calls the FastAPI nano-service and includes this token in the
Authorization: Bearer <token>header. - Token Validation: The FastAPI service (or an API Gateway/service mesh layer like Envoy) receives the token and must validate it. This check confirms the token’s issuer (your Entra tenant), audience (that it was intended for this specific service), signature (it hasn’t been tampered with), and expiration.
- Authorization: Once validated, the service can trust the token’s “claims” (like
rolesorscp- scopes) to determine what the caller is allowed to do.
This pattern delegates all authentication logic to Entra ID, allowing your nano-services to focus only on validating tokens and enforcing business logic.
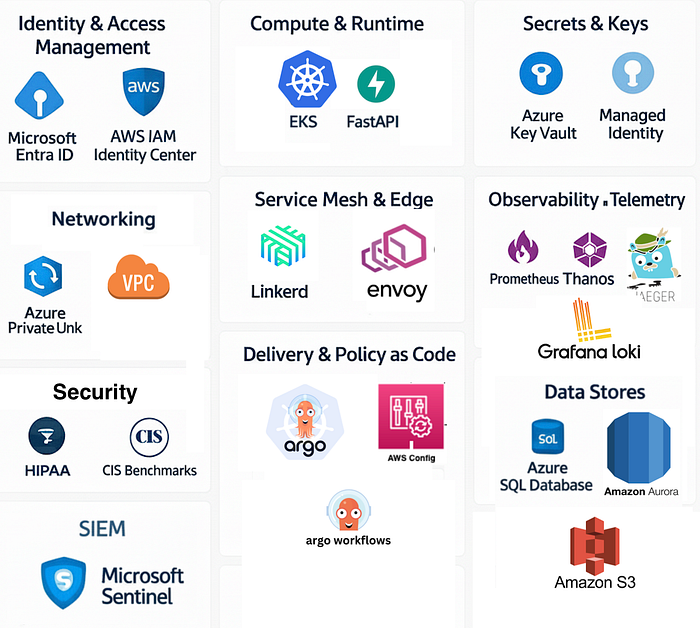
Resources overview
Special note: In this post, we will focus on implementing the tooling and not the infrastructure, since this is extensively covered in both AWS and Azure documentation.
Identity control plane
- Microsoft Entra ID (single place for SSO, Conditional Access, MFA, PIM). Federate Entra with AWS IAM Identity Center / AWS SSO for unified login across AWS accounts. (optional)
Compute and runtime
- Primary: Azure Kubernetes Service (AKS) or (EKS)/ Container Apps running FastAPI containers.
- Nano-service pattern (DDD): small FastAPI services per bounded context (Claims, Policies, Billing). Each service has its own DB and schema.
Networking
- There are private endpoints / Private Links for all managed services (Key Vault, SQL, Blob), but no public DB endpoints.
- Cross-cloud private connectivity: ExpressRoute/DirectConnect/Partner Interconnect or encrypted Transit paths — traffic stays on non-public backbones where possible.
Secrets & Keys
- Azure Key Vault (HSM-backed CMKs) for encryption keys & secrets; accessible only via private endpoint and Managed Identity.
Service mesh + edge
- Linkerd (or Envoy sidecars) for automatic mTLS, traffic policies, and observability. Linkerd provides automatic mTLS and telemetry across meshed pods. ( Linkerd)
Observability
- Prometheus for short-term metrics; Thanos or Cortex for long-term storage and multi-region HA. ( Thanos)
- Jaeger (or managed backend) for traces; logs to Azure Monitor / Sentinel for SIEM.
- OpenTelemetry for traces/metrics/log correlation. ( OpenTelemetry)
Delivery & policy
- GitOps via Argo CD + Argo Workflows; admission controls via OPA/Gatekeeper and Conftest in CI.
Compliance automation
- Azure Policy + Defender for Cloud for CSPM ( Cloud Security Posture Management) and CIS mapping( Center for Internet Security); AWS Security Hub / Config for the AWS side. Azure offers HIPAA-supporting programs/BAA. ( HIPAA MS Azure)
Code-Level Libraries & Frameworks
These are components you import directly into your application’s code. They are dependencies of your service, not separate systems you deploy.
- FastAPI: A web framework used to build your Python application/API.
- OpenTelemetry (OTEL): A telemetry framework (a collection of APIs and SDKs/libraries) used to instrument your application. It generates and exports traces, metrics, and logs from your code.
Why these CNCF projects and where to start learning?
- OpenTelemetry — vendor-neutral instrumentation makes traces portable and auditable across clouds. Use it to create the trace evidence required for incident investigations and HIPAA audits. ( CNCF)
- Linkerd — zero-config mTLS, low ops burden, direct telemetry and SLO-friendly metrics (good fit for SRE teams focused on reliability). ( Linkerd)
- Envoy — advanced L7 proxy for custom routing or advanced auth needs (JWT, OIDC validation). Use at the cluster edge when you need fine control.
- Prometheus + Thanos/Cortex — immediate short-term monitoring with enterprise long-term retention for compliance evidence. ( thanos.io)
- Argo CD — declarative delivery with strong audit trail and rollback semantics (Git = source of truth).
Core Technology Definitions
Keep in mind that you can use Kubernetes in any cloud provider, and some resources where you will host might vary, but the idea still remains. For practical use, I will use AKS, but you can even use EKS.
A Kubernetes cluster is the foundational platform. It’s an open-source system for automating the deployment, scaling, and management of containerized applications. It manages the application’s lifecycle across a group of machines (nodes), handling everything from networking to storage to self-healing.
FastAPI is a modern, high-performance Python web framework used for building APIs. It’s known for its incredible speed (comparable to NodeJS or Go) and its use of standard Python type hints to automatically validate data and generate interactive API documentation (like Swagger UI).
OTLP is a vendor-neutral protocol for sending telemetry data (metrics, logs, and traces). It’s a key part of the OpenTelemetry project, allowing your applications and infrastructure to export observability data in a single, standard format to any compatible backend, like Jaeger.
Jaeger is an open-source, end-to-end distributed tracing system. It’s used to monitor and troubleshoot complex microservice environments. It ingests trace data (often via OTLP) and provides a UI to visualize the complete path of a request as it flows through different services, making it easy to pinpoint latency bottlenecks and errors.
ArgoCD is a declarative GitOps continuous delivery (CD) tool for Kubernetes. It works by making a Git repository the “single source of truth” for your application’s desired state. ArgoCD automatically monitors the repository and synchronizes the live state of your Kubernetes cluster to match the state defined in Git.
OPA is an open-source, general-purpose policy engine that allows you to enforce Policy as Code. In a Kubernetes context, it’s most often used as an admission controller. It intercepts requests to the Kubernetes API and validates them against policies (written in a language called Rego) to ensure they comply with security, compliance, or operational rules before they are applied to the cluster.
Implementation highlights & small recipes
FastAPI instrumentation (example)
Instrument server with OpenTelemetry (OTLP exporter) — push traces to collector sidecars that forward to the Jaeger/OTLP backend, and is nice to have in the age of AI agents.
# minimal.py
import os
from contextlib import asynccontextmanager

from fastapi import FastAPI
from opentelemetry import trace
from opentelemetry.exporter.otlp.proto.grpc.trace_exporter import OTLPSpanExporter
from opentelemetry.instrumentation.fastapi import FastAPIInstrumentor
from opentelemetry.sdk.resources import SERVICE_NAME, Resource
from opentelemetry.sdk.trace import TracerProvider
from opentelemetry.sdk.trace.export import BatchSpanProcessor

SERVICE_NAME_CONFIG = os.getenv("OTEL_SERVICE_NAME", "claims-service")
OTLP_ENDPOINT_CONFIG = os.getenv("OTEL_EXPORTER_OTLP_ENDPOINT", "otel-collector:4317")

def setup_telemetry():
    """Configures and sets the global tracer provider."""
    # Create a Resource to identify the service
    resource = Resource.create({SERVICE_NAME: SERVICE_NAME_CONFIG})

    # Create a TracerProvider
    provider = TracerProvider(resource=resource)

    # Create an OTLP Span Exporter
    exporter = OTLPSpanExporter(endpoint=OTLP_ENDPOINT_CONFIG, insecure=True)

    # Use a BatchSpanProcessor to send spans in batches
    provider.add_span_processor(BatchSpanProcessor(exporter))

    trace.set_tracer_provider(provider)

    return provider

@asynccontextmanager
async def lifespan(app: FastAPI):
    """Handles startup and shutdown events."""
    # Setup telemetry on startup
    provider = setup_telemetry()
    FastAPIInstrumentor.instrument_app(app, tracer_provider=provider)
    yield
    # Properly shutdown the provider on exit to flush spans
    provider.shutdown()

app = FastAPI(lifespan=lifespan)

# Add a simple endpoint to verify it's working
@app.get("/")
def read_root():
    return {"hello": "world"}A more enhanced version will be:
# enhanced.py

import os
from contextlib import asynccontextmanager
from typing import Dict

from fastapi import FastAPI, Request
from opentelemetry import trace
from opentelemetry.exporter.otlp.proto.grpc.trace_exporter import OTLPSpanExporter
from opentelemetry.instrumentation.fastapi import FastAPIInstrumentor
from opentelemetry.sdk.resources import (
    DEPLOYMENT_ENVIRONMENT,
    SERVICE_NAME,
    SERVICE_VERSION,
    Resource,
)
from opentelemetry.sdk.trace import TracerProvider
from opentelemetry.sdk.trace.export import BatchSpanProcessor
from opentelemetry.sdk.trace.sampling import ParentBased, TraceIdRatioBased
from opentelemetry.semconv.trace import SpanAttributes
from opentelemetry.trace import Span

# --- 1. Configuration is now grouped by concern ---

# Service identity
SERVICE = os.getenv("OTEL_SERVICE_NAME", "claims-service")
ENV = os.getenv("OTEL_DEPLOYMENT_ENVIRONMENT", "prod")
VERSION = os.getenv("OTEL_SERVICE_VERSION", "1.0.0")

# OTLP Exporter endpoint configuration
OTLP_ENDPOINT = os.getenv("OTEL_EXPORTER_OTLP_ENDPOINT", "http://otel-collector:4317")
OTLP_INSECURE = os.getenv("OTEL_EXPORTER_OTLP_INSECURE", "true").lower() == "true"
OTLP_HEADERS = os.getenv("OTEL_EXPORTER_OTLP_HEADERS") # e.g. "key1=value1,key2=value2"

# Sampling configuration
TRACE_RATIO = float(os.getenv("OTEL_TRACES_SAMPLER_ARG", "0.10"))

# --- 2. Telemetry Setup ---

# Create a resource to describe the service
resource = Resource.create(
    {
        SERVICE_NAME: SERVICE,
        SERVICE_VERSION: VERSION,
        DEPLOYMENT_ENVIRONMENT: ENV,
    }
)

# Set up a sampler
sampler = ParentBased(TraceIdRatioBased(TRACE_RATIO))

# Set up a tracer provider
provider = TracerProvider(resource=resource, sampler=sampler)

# Configure the OTLP exporter
exporter_kwargs = {
    "endpoint": OTLP_ENDPOINT,
    "insecure": OTLP_INSECURE,
}
if OTLP_HEADERS:
    # --- IMPROVEMENT: More robust header parsing ---
    exporter_kwargs["headers"] = dict(
        item.split("=") for item in OTLP_HEADERS.split(",")
    )

span_exporter = OTLPSpanExporter(**exporter_kwargs)
provider.add_span_processor(BatchSpanProcessor(span_exporter))

# Set the global tracer provider
trace.set_tracer_provider(provider)
tracer = trace.get_tracer(__name__)

# --- 3. Custom Hooks for enriching spans (with improvements) ---

# --- IMPROVEMENT: Use OpenTelemetry Semantic Conventions for attributes ---
def _server_request_hook(span: Span, scope: dict):
    """Enrich server spans with client IP and port."""
    if span and span.is_recording():
        client_info = scope.get("client")
        if client_info:
            span.set_attribute(SpanAttributes.CLIENT_ADDRESS, client_info[0])
            span.set_attribute(SpanAttributes.CLIENT_PORT, client_info[1])
        # REMOVED: `http.route` is already set correctly by the instrumentor.

def _server_response_hook(span: Span, request: Request, response: Response):
    """Add a custom attribute for the HTTP status family (e.g., 2xx, 4xx)."""
    if span and span.is_recording():
        status_code = response.status_code
        span.set_attribute("http.status_family", f"{status_code // 100}xx")

# --- 4. FastAPI Lifespan for setup and teardown ---

@asynccontextmanager
async def lifespan(app: FastAPI):
    """Instrument the app on startup and shutdown the provider on exit."""
    FastAPIInstrumentor.instrument_app(
        app,
        tracer_provider=provider,
        server_request_hook=_server_request_hook,
        server_response_hook=_server_response_hook,
        # --- IMPROVEMENT: Exclude health checks to reduce noise and cost ---
        excluded_urls="/healthz",
    )
    yield
    # Cleanly shutdown the tracer provider
    provider.shutdown()

app = FastAPI(lifespan=lifespan)

# --- 5. Application Endpoints ---

@app.get("/healthz")
async def healthz():
    """A minimal endpoint for readiness/liveness probes."""
    return {"status": "ok"}

@app.get("/claims/{claim_id}")
async def get_claim(claim_id: str, request: Request) -> Dict[str, str]:
    """Example business logic endpoint with a custom span."""
    # The FastAPI instrumentor creates the parent span automatically.
    # This custom span will be a child of the request span.
    with tracer.start_as_current_span("load_claim_data") as span:
        span.set_attribute("claim.id", claim_id)
        # ... your business logic to load data from a DB or another service
        return {"claim_id": claim_id, "status": "open"}
Disclaimer
Running the code above and below requires some additional configurations to be persistent, and based on your environment, further modifications may be suggested.
# Example env for a sidecar in the same Pod (gRPC)
export OTEL_SERVICE_NAME=claims-service
export OTEL_SERVICE_VERSION=1.4.2
export OTEL_DEPLOYMENT_ENVIRONMENT=dev
export OTEL_EXPORTER_OTLP_ENDPOINT=http://otel-collector:4317
export OTEL_EXPORTER_OTLP_INSECURE=true
export OTEL_TRACES_SAMPLER_ARG=0.10
uvicorn app:app --host 0.0.0.0 --port 8080
Minimal Collector sidecar config (traces → Jaeger + OTLP)
Use this in your Pod as a sidecar (adjust exporters as needed):
# ot-collector-config.yaml
receivers:
  otlp:
    protocols:
      grpc:
      http:

processors:
  batch:
  attributes:
    actions:
      - key: k8s.pod.uid
        action: upsert
        from_attribute: k8s.pod.uid

exporters:
  jaeger:
    endpoint: jaeger-collector:14250
    tls:
      insecure: true
  otlp:
    endpoint: otel-gateway:4317
    tls:
      insecure: true
    # headers:
    #   authorization: "Bearer ${GATEWAY_TOKEN}"

service:
  pipelines:
    traces:
      receivers: [otlp]
      processors: [batch, attributes]
      exporters: [jaeger, otlp]
Optional add-ons
- Metrics & logs: add
OTLPMetricExporter/OTLPLogExporterand matching pipelines in the Collector. - More context: propagate baggage (e.g.,
customer.id) withopentelemetry.baggage. - Database & outbound calls: enable
SQLAlchemyInstrumentor,RequestsInstrumentor, etc., to get spans for dependencies automatically.
Deploy an OTLP collector as a DaemonSet or sidecar. Correlate trace IDs to logs for audit trails.
Linkerd quick win
Install Linkerd for automatic mTLS, traffic metrics, and basic policy:
# validate and install
linkerd check - pre && linkerd install | kubectl apply -f -
# inject into a deployment
kubectl get deploy -n claims -o yaml | linkerd inject - | kubectl apply -f -
Linkerd secures pod-to-pod communication without code changes, producing telemetry that SREs can use to prove enforcement.
Linkerd Quick Win (mTLS Policy)
After installing Linkerd (as shown), you can create a ServerAuthorization policy to enforce mTLS and only allow traffic from a specific service (e.g., it claims-service can only be called by policy-service).
# authz-claims-service.yaml
apiVersion: policy.linkerd.io/v1beta2
kind: ServerAuthorization
metadata:
  name: claims-service-access
  namespace: claims
spec:
  server:
    selector:
      matchLabels:
        app: claims-service
  client:
    meshTLS:
      identities:
        # Only allow traffic from the policy-service's service account
        - "policy-service.policy.serviceaccount.identity.linkerd.cluster.loc
OPA/Gatekeeper Quick Win (Policy as Code)
Deploy Gatekeeper and add a ConstraintTemplate to enforce CIS-mapped controls, such as disallowing public-facing load balancers.
# constraint-template.yaml
apiVersion: templates.gatekeeper.sh/v1
kind: ConstraintTemplate
metadata:
  name: k8sdisallowpublicloadbalancer
spec:
  crd:
    spec:
      names:
        kind: K8sDisallowPublicLoadBalancer
  targets:
    - target: admission.k8s.gatekeeper.sh
      rego: |
        package k8sdisallowpublicloadbalancer

        violation[{"msg": msg}] {
          input.review.object.kind == "Service"
          input.review.object.spec.type == "LoadBalancer"
          not input.review.object.metadata.annotations["service.beta.kubernetes.io/azure-load-balancer-internal"] == "true"
          msg := "Services of type LoadBalancer must be internal. Add the 'service.beta.kubernetes.io/azure-load-balancer-internal: \"true\"' annotation."
        }
Prometheus → Thanos (retention)
- Local Prometheus (Per Cluster): Each Kubernetes cluster runs its own Prometheus instance. This is the most reliable way to scrape local targets (like your nano-services and Linkerd proxies). Each Prometheus is autonomous, limiting the “blast radius” of any failure. It’s configured to retain only a short window of data (e.g., 24–48 hours) on its local disk.
- Thanos Sidecar (Alongside Prometheus): A “sidecar” container runs in the same Pod as Prometheus. Its primary job is to watch for new metric blocks created by Prometheus (typically every 2 hours) and upload them to a central, inexpensive object storage bucket (like Azure Blob, GCS, or S3). This is the key to long-term retention.
- Thanos Querier (The Global View): You deploy one or more stateless Thanos Querier components centrally. These are what your Grafana dashboards connect to. When the Querier receives a query (PromQL), it intelligently fetches data from two places:
- Object Storage: For all historical data (e.g., “last 90 days”).
- Local Prometheus Instances: For the most recent, “real-time” data that hasn’t been uploaded to object storage yet.
SRE nice to have
- Define SLOs per nano-service (latency, error rate). Use Linkerd metrics + Prometheus.
- Alerts map to runbooks with trace and log links (trace ID + Jaeger + logs). Store snapshots as part of the incident ticket.
- Regularly run compliance smoke tests (encryption, private endpoint checks, policy drift). Automate with pipelines.
Understanding Compliance Mapping: CIS + HIPAA
Before diving into what to automate, it’s crucial to understand compliance mapping. This involves identifying the overlap between various regulatory frameworks and security standards.
In this case, we’re mapping:
- CIS Benchmarks: A set of best practices for securely configuring systems (like servers, cloud environments, and desktops).
- HIPAA (Health Insurance Portability and Accountability Act): A US federal law that requires strict privacy and security standards to protect sensitive patient health information (PHI).
Why map them? Instead of building separate security programs for each (which is inefficient and redundant), mapping allows you to find common ground. For example, a single technical control, like “enforce Multi-Factor Authentication (MFA),” can simultaneously satisfy specific requirements from both CIS and HIPAA.
By finding these overlaps, you create a unified control set. This enables you to automate a single technical solution that meets multiple standards simultaneously, saving significant time and effort.
Automation Priorities for CIS + HIPAA Compliance
With that understanding, here are the high-impact areas to automate first, as they map to multiple CIS and HIPAA requirements (like access control, data protection, and audit logging):
Identity & Access Management (IAM)
- Automation Goal: Enforce Conditional Access policies and mandatory MFA for all human administrative and user logins (e.g., using Entra ID).
- Privilege Control: Implement Privileged Identity Management (PIM) for just-in-time (JIT) access to privileged roles, ensuring admins don’t have standing high-level access.
- Federation: Document and automate the federation between your primary identity provider and other platforms (e.g., Entra ID <-> AWS SSO) to maintain a single source of truth for identities.
Data Protection (At-Rest & In-Transit):
- Encryption Keys: Automate the deployment of Customer-Managed Keys (CMKs) in a secure service (like Azure Key Vault) and ensure they are only accessible via private endpoints.
- Database Security: Enforce database encryption, such as Transparent Data Encryption (TDE) or Always Encrypted for sensitive columns, as part of the automated database provisioning process.
Logging, Monitoring & Retention:
- Immutable Logs: Use Infrastructure as Code (IaC) (like Terraform) with pipeline quality gates to enforce the creation of immutable log storage (e.g., append-only object storage).
- Retention Policies: Automatically apply and enforce data retention policies (e.g., 7 years for HIPAA) on all audit and security logs.
- SIEM Integration: Automate the log export pipeline from all services to your SIEM (like Microsoft Sentinel) for real-time threat detection and correlation.
Network Security:
- Zero Trust Networking: Mandate private endpoints for all PaaS services (storage, databases, key vaults), eliminating public internet exposure for backend services.
- East-West Traffic: Implement a service mesh (like Istio or Linkerd) to enforce mutual TLS (mTLS) and fine-grained authorization policies for communication between microservices.
- Proactive Compliance: Develop a library of policy templates (e.g., using Open Policy Agent — OPA) that directly map to specific CIS benchmarks and HIPAA controls.
- Shift-Left & Runtime: Integrate these policies into your CI/CD pipeline to block non-compliant infrastructure before deployment and into your runtime environment (e.g., Kubernetes admission controller) to prevent configuration drift.
90-day implementation roadmap
Guiding Principles & Risk Mitigation (Your Decision Framework)
You must adhere to these directives to manage operational risk as you build:
- To Mitigate Complexity Creep: You will prefer managed SaaS where the operational cost exceeds the benefit. Selectively adopt new CNCF projects only after a clear cost/benefit analysis.
- To Mitigate Configuration Drift, you will enforce GitOps as the only path for configuration changes. You must also run daily drift scans and immediately remediate all findings.
- To Mitigate Egress & Data Residency Risk: You will localize analytics and backups. Use private service connections as the default. Any configuration requiring new egress paths must be explicitly justified and approved.
Program Epics & Sprint Breakdown
This plan outlines the 12-week implementation roadmap, the primary operational risks to be managed during execution, and the final audit criteria to validate success.
Sprint Weeks Primary Epics & Key Stories

Sprint 1 0–2
Epic: Zero Trust Identity.
Story: Federate Entra ID with AWS SSO.
Story: Configure baseline Conditional Access (MFA).
Story: Implement PIM for elevated AWS roles.

Sprint 2 2–4
Epic: Observability Foundation.
Story: Instrument one FastAPI service with OpenTelemetry SDK.
Story: Deploy and configure the OTLP Collector in dev.
Story: Validate end-to-end trace propagation.

Sprint 3 4–6
Epic: Service Mesh (Phase 1).
Story: Deploy Linkerd control plane to dev cluster.
Story: Onboard two non-critical services to the mesh.
Story: Validate Linkerd telemetry pipeline.

Sprint 4 6–8
Epics: Service Mesh (Phase 2) & Metrics (Phase 1).
Story: Enforce default-deny mTLS policy in dev.
Story: Deploy local Prometheus operator.
Story: Begin Thanos sidecar/receiver configuration.

Sprint 5 8–10
Epics: Metrics (Phase 2) & GitOps (Phase 1).
Story: Configure immutable object storage for Thanos.
Story: Validate metric retention (e.g., query 30-day old data).
Story: Bootstrap Argo CD in mgmt cluster.

Sprint 6 10–12
Epic: GitOps & Policy as Code.
Story: Migrate 3 key services to be managed by Argo CD.
Story: Deploy OPA Gatekeeper.
Story: Implement 3 critical CIS/HIPAA admission policies (e.g., "disallow hostPath").
Standing Orders (Ongoing Responsibilities)
These tasks are continuous throughout the 12 weeks. They are not optional.
- Maintain Continuous Scanning: You must keep Defender / CSPM active. Triage all “High” and “Critical” alerts daily. This is your primary validation method for controls like: $\square$ Key Vault CMKs in HSM, private endpoint enabled.
- Execute Continuous Testing: You will coordinate and run continuous penetration tests against the new infrastructure as it’s deployed.
- Document as You Go: You must create and update runbooks for every new capability you deploy.
How to start testing?
- Start small: instrument a single FastAPI nano-service with OpenTelemetry, push to your collector, and link traces to logs.
- Enable Linkerd in dev to get automatic mTLS and service telemetry with minimal code changes.
- Make GitOps the gate for all infra changes and bake CIS/HIPAA checks into CI.
- Treat telemetry as compliance evidence — retention and immutability are non-negotiable.
Need assistance? We’re happy to help.
If you are evaluating this for a proof of concept or planning deployments, DoiT can help. Our team of 100+ experts specializes in tailored cloud solutions, ready to guide you through the process and optimize your infrastructure for compliance and future demands.
Let’s discuss what makes the most sense for your company during this policy enforcement phase, ensuring your cloud infrastructure is robust, compliant, and optimized for success. Contact us today.
Key claims and references: Entra federates with AWS SSO, Azure supports HIPAA/BAA, OpenTelemetry and Linkerd are CNCF-backed projects, and Thanos provides Prometheus long-term retention. ( Microsoft Learn)