
In the world of NoSQL cloud databases, Firestore stands out as a flexible and scalable solution for mobile, web, and server development. However, even with its impressive capabilities, there’s a common misconception that Firestore can handle any load thrown at it without breaking a sweat. While theoretically true, the reality is a bit more nuanced. Imagine you’re launching your latest and greatest feature and have experienced huge spikes in traffic in the past. Or, you know your user patterns and at a specific part of the day, you expect a severely increased load. In this post, we’ll explore a common Firestore scaling problem and introduce you to a practical way to test and avoid it.
The 500/50/5 Rule: A Gentle Introduction to Firestore
Firestore is designed for scale, but like any elastic and distributed system, it needs time to adjust to increasing loads. This is where the 500/50/5 rule comes into play:
Start with a maximum of 500 operations per second to a new collection, then increase traffic by 50% every 5 minutes.
This guideline ensures that Firestore’s internal scaling mechanisms can keep up with your growth, preventing common issues like high latency or DEADLINE_EXCEEDED errors.
Enter k6: Your Load Testing Ally
To illustrate the importance of the 500/50/5 rule, we’ve created a script using k6, an open-source load-testing tool. k6is an excellent choice for several reasons:
- It’s simple to use with a JavaScript-based scripting language.
- It provides real-time performance metrics and detailed insights.
- It’s highly scalable, capable of generating 100,000–300,000 requests per second from a single instance.
The script
The script can be found here. An overview of what it does:
Initial and Target Load:
- Starts at 500 requests per second (RPS)
- Aims to reach 1500 RPS (you can play with this of course)
Ramping Strategy:
- Maintains each load level for 5 minutes (300 seconds)
- Increases load by 50% over 1-minute periods
- Continues this pattern until reaching or exceeding the target RPS
Dynamic Stage Generation:
- Automatically calculates the number of stages needed
- Creates a series of alternating ‘stable’ and ‘ramp-up’ stages
- Logs each stage’s target RPS and duration for clarity
Document Selection:
- Reads document IDs from a file (‘orders.txt’)
- Randomly selects a document ID for each request
- You will need to get these document IDs for your own use case as I generated a fake dataset
Request Execution:
- Performs GET requests to the Firestore REST API
- Includes authentication via a bearer token
- I have included a script that gets a token for you as well
Performance Monitoring:
- Tracks successful reads and errors
- Logs any non-200 status codes with details
You can run the script using k6 run warm-up.js after installingk6(using e.g.brewif you are on Mac). You can get a token for the script using generate-firebase-token.py. For both scripts there are a few variables to update, please use “Find” in your editor and search for INSERT.
The Experiment: Success vs. Failure
We ran two experiments to demonstrate the impact of following (or ignoring) the 500/50/5 rule, allowing you to see the difference in action:
Experiment 1: Setting Up for Failure
In this scenario, we started with 2000 requests per second (RPS) and ramped up to 2500 RPS over 5 minutes, completely disregarding the 500/50/5 rule.
```js
// Warmup parameters
const initialRPS = 2000;
const targetRPS = 2500;
const stablePeriodSeconds = 300; // 5 minutes
const rampPeriodSeconds = 0;
const stageCount = Math.ceil(Math.log(targetRPS / initialRPS) / Math.log(1.5));
```
Ran between 1/1/10 between 0110 and 0115 CEST
Results:
```bash
INFO[0335] Warmup Stages:                                source=console
INFO[0335] Stage 1: Target RPS: 2500, Duration: 300s     source=console
     ✗ status is 200
      ↳  4% — ✓ 6408 / ✗ 123474
     checks.........................: 4.93%  ✓ 6408       ✗ 123474
     data_received..................: 23 MB  70 kB/s
     data_sent......................: 4.6 MB 14 kB/s
     dropped_iterations.............: 1      0.003028/s
     errors.........................: 123474 373.866077/s
     http_req_blocked...............: avg=473.49ms min=0s       med=0s     max=59.9s  p(90)=0s     p(95)=0s
     http_req_connecting............: avg=287.6ms  min=0s       med=0s     max=38.39s p(90)=0s     p(95)=0s
     http_req_duration..............: avg=806.08ms min=0s       med=0s     max=1m3s   p(90)=0s     p(95)=2.01s
       { expected_response:true }...: avg=12.62s   min=311.44ms med=9.48s  max=1m0s   p(90)=30.92s p(95)=36.56s
     http_req_failed................: 95.06% ✓ 123474     ✗ 6409
     http_req_receiving.............: avg=82.85ms  min=0s       med=0s     max=59.4s  p(90)=0s     p(95)=30µs
     http_req_sending...............: avg=651.35µs min=0s       med=0s     max=8.82s  p(90)=0s     p(95)=92µs
     http_req_tls_handshaking.......: avg=261.72ms min=0s       med=0s     max=57.6s  p(90)=0s     p(95)=0s
     http_req_waiting...............: avg=722.58ms min=0s       med=0s     max=1m2s   p(90)=0s     p(95)=1.89s
     http_reqs......................: 129883 393.271845/s
     iteration_duration.............: avg=32.65s   min=2.58µs   med=33.98s max=1m12s  p(90)=48.47s p(95)=51.64s
     iterations.....................: 129883 393.271845/s
     successful_reads...............: 4.93%  ✓ 6408       ✗ 123474
     vus............................: 47     min=0        max=25000
     vus_max........................: 25000  min=4179     max=25000
running (5m30.3s), 00000/25000 VUs, 129882 complete and 21 interrupted iterations
firestore_warmup ✓ [======================================] 00021/25000 VUs  5m0s  2105.47 iters/s
```
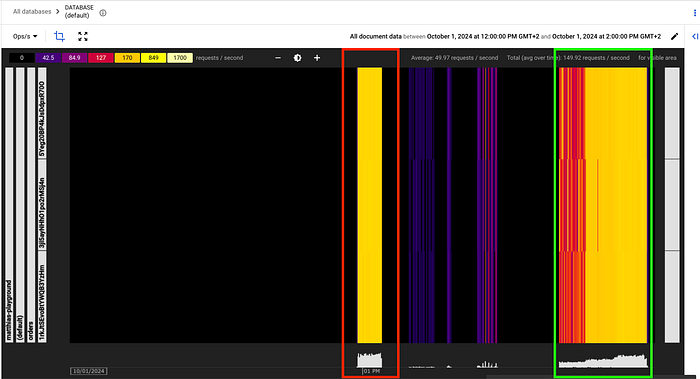
What this looks like in Key Visualiser:
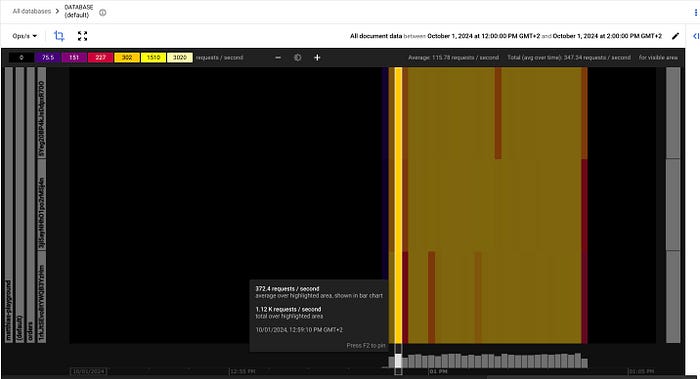
The results? A success rate under 5%. Ouch.
Experiment 2: Setting Up for Success
For this test, we adhered to the 500/50/5 rule, starting at 500 RPS and gradually increasing to 1500 RPS over about 20 minutes.
```js
// Warmup parameters
const initialRPS = 500;
const targetRPS = 1500;
const stablePeriodSeconds = 300; // 5 minutes
const rampPeriodSeconds = 60; // 1 minute
const stageCount = Math.ceil(Math.log(targetRPS / initialRPS) / Math.log(1.5));
```

Ran between 1/1/10 between 0140 and 0158 CEST

Results:
```bash
INFO[1111] Warmup Stages:                                source=console
INFO[1111] Stage 1: Target RPS: 500, Duration: 300s      source=console
INFO[1111] Stage 2: Target RPS: 750, Duration: 60s       source=console
INFO[1111] Stage 3: Target RPS: 750, Duration: 300s      source=console
INFO[1111] Stage 4: Target RPS: 1125, Duration: 60s      source=console
INFO[1111] Stage 5: Target RPS: 1125, Duration: 300s     source=console
INFO[1111] Stage 6: Target RPS: 1500, Duration: 60s      source=console

     ✗ status is 200
      ↳  99% — ✓ 863739 / ✗ 231

     checks.........................: 99.97% ✓ 863739     ✗ 231
     data_received..................: 1.5 GB 1.4 MB/s
     data_sent......................: 173 MB 156 kB/s
     dropped_iterations.............: 20999  18.915827/s
     errors.........................: 231    0.208084/s
     http_req_blocked...............: avg=50.75ms  min=0s       med=0s       max=41.09s p(90)=1µs      p(95)=1µs
     http_req_connecting............: avg=35.83ms  min=0s       med=0s       max=29.93s p(90)=0s       p(95)=0s
     http_req_duration..............: avg=554.84ms min=0s       med=334.66ms max=1m0s   p(90)=728.85ms p(95)=1.29s
       { expected_response:true }...: avg=554.07ms min=304.44ms med=334.66ms max=59.46s p(90)=728.84ms p(95)=1.29s
     http_req_failed................: 0.02%  ✓ 231        ✗ 863739
     http_req_receiving.............: avg=68.05ms  min=0s       med=6.92ms   max=59.42s p(90)=21.82ms  p(95)=160.12ms
     http_req_sending...............: avg=288.4µs  min=0s       med=32µs     max=12.11s p(90)=89µs     p(95)=150µs
     http_req_tls_handshaking.......: avg=16.93ms  min=0s       med=0s       max=46.68s p(90)=0s       p(95)=0s
     http_req_waiting...............: avg=486.5ms  min=0s       med=327.66ms max=1m0s   p(90)=615.6ms  p(95)=943.67ms
     http_reqs......................: 863970 778.261194/s
     iteration_duration.............: avg=609.81ms min=2.2µs    med=334.94ms max=1m0s   p(90)=748.42ms p(95)=1.35s
     iterations.....................: 863970 778.261194/s
     successful_reads...............: 99.97% ✓ 863739     ✗ 231
     vus............................: 14     min=14       max=5720
     vus_max........................: 5849   min=1000     max=5849

running (18m30.1s), 00000/05849 VUs, 863970 complete and 14 interrupted iterations
firestore_warmup ✓ [======================================] 00014/05849 VUs  18m0s  1499.93 iters/s
```
What this looks like in Key Visualiser:
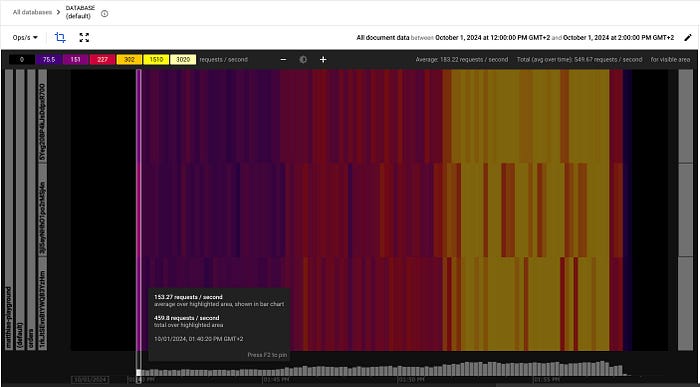
Start of scaling
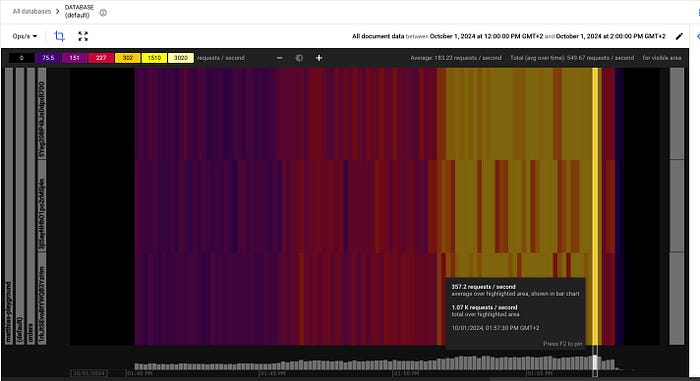
End of scaling
The outcome? An impressive 99.97% success rate.
Running Your Own Tests
We can run the script with k6 locally which has a few advantages like easy set-up, no costs, etc. However, you might be limited by the resources of your local machine, have only one instance, and results might be affected by your network constraints. For more accurate results, it might make sense to run the script on a (Google Cloud) VM.
The 500/50/5 rule isn’t just a suggestion — it’s a crucial guideline for ensuring your Firestore implementation scales smoothly and efficiently. By following this rule and using tools like k6 to test your scaling strategies, you can avoid performance pitfalls and keep your application running smoothly as it grows.
Remember, when it comes to database scaling, slow and steady wins the race. Happy scaling!
— -
Want to dive deeper into Firestore scaling or need help optimizing your cloud infrastructure? Visit doit.com to learn how we can assist you in maximizing your cloud potential.