
LLMs So Hot They Burn A Hole In Your Pocket
Remember the early days of the cloud? Our biggest FinOps headache was the un-tagged VM. A dev would spin up a huge server, forget to label it, and BAM! We have an annoyingly mysterious unallocated spend at the end of the month. Sure, it was painful, but usually, the cost only built up over weeks.
Well, buckle up. FinOps for AI is here, and it’s about to give you whiplash. The new cost black hole isn’t an undercover server, it’s runaway tokens.
When an unoptimized prompt hits an expensive LLM 100 times a second, your budget doesn’t just leak… it explodes. We’re talking budget-busting cost spikes that happen in hours, not months.
The solution? We need to shift our focus from infrastructure tagging to application-level telemetry. We need to track the cost of every single token, in real-time.
This becomes especially important when talking about AI agents — not the chatbots where each session can be easily linked to a specific user, but an autonomous agent potentially doing work for the whole team.
FinOps For AI: Cloud Telemetry Isn’t Enough
The old way of tracking cost — using cloud provider bills (Cost Explorer, Cost Management, etc.) is too slow and too coarse for AI API usage.
The following table compares FinOps 1.0 to the emerging FinOps for AI:
| Feature          | Early Cloud FinOps             | Current AI FinOps (API)
|------------------|--------------------------------|----------------------------------------
| Cost Unit        | VM Hour, GB of Storage         | Input Token, Output Token
-------------------|--------------------------------|-----------------------------------------
| Cost Driver      | Idle resources,                | Prompt efficiency,
|                  | network egress                 | model selection
-------------------|--------------------------------|-----------------------------------------
| Cost Visibility  | Daily/Hourly Billing Logs      | Real-Time Per-Transaction Telemetry
-------------------|--------------------------------|-----------------------------------------
| Optimization Tool| Shutting down servers          | - Rewriting the prompt/code
|                  |                                | - Real-time model selection
-------------------|--------------------------------|-----------------------------------------
To truly manage costs for AI applications, we can’t wait for the bill. We need FinOps intelligence embedded directly into the application layer, reporting on every single token that gets sent or received. This is where OpenTelemetry (OTel) comes to our rescue.
Tutorial: Instrumenting Your AI Agent with OpenTelemetry
OpenTelemetry is an open-source framework that provides a single standard for collecting observability data (traces, metrics, and logs). We can use its tracing capabilities to wrap our LLM calls and inject the critical FinOps context we need.
The following example shows how to implement FinOps cost allocation tracking for AI agents using OpenTelemetry and Google’s Agent Development Kit (ADK).
This code is your key to FinOps freedom. It ensures every token used by your AI agent is instantly tagged with the correct budget owner. No more guessing games!
The fully runnable code is right here: https://github.com/antweiss/finops-ai-otel.
IMPORTANT DISCLAIMER: Not Fit for Prod!
For this tutorial, we use ConsoleSpanExporter to print raw trace data to your terminal. In a production environment, you would NEVER do this!
Instead, you would replace the console exporter with a dedicated OTLP Exporter that sends the data to a robust backend service like:
- Google Cloud Trace: The native option for Google Cloud users.
- A Managed Observability Backend: Such as Jaeger, Datadog, or New Relic.
- A Dedicated FinOps management platform like DoiT Cloud Intelligence
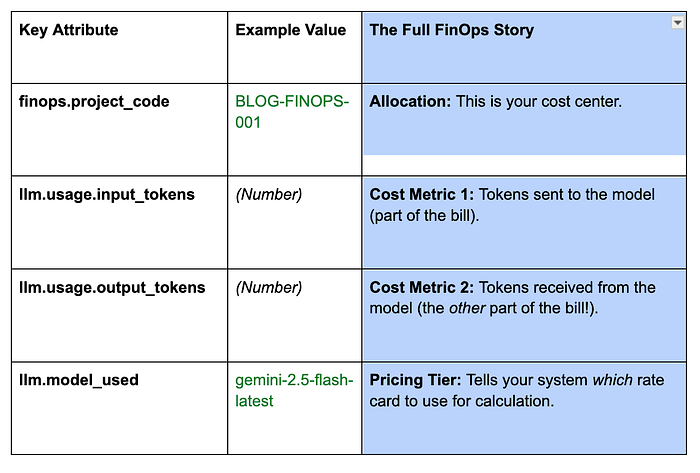
These backends allow you to query and aggregate the data, running FinOps reports like: “Show me the total number of tokens used where finops.project_code is ‘BLOG-FINOPS-001’ over the last 30 days.” That’s how you turn a trace into a cost report!
Step 1 & 2: Get Ready to Run
You know the drill! Clone the repo, install the dependencies, and set your API key.
git clone https://github.com/antweiss/finops-ai-otel.git
cd finops-ai-otel
pip install -r requirements.txt
export GEMINI_API_KEY="YOUR_API_KEY_HERE"
Step 3: Run the Code and See the Tokens Spill!
When you run the file agent.py, the FinOps superpower is activated inside the run_finops_session function.
python agent.py
How the FinOps Tags Get In (The Code Breakdown)
The goal is to wrap the agent’s entire activity in a custom OpenTelemetry Span that carries our budget details.
Starting the FinOps Span:
with tracer.start_as_current_span("adk-agent-session") as span:
This line is the whole trick! We start a span and declare it the current active span. Any subsequent code that is also instrumented with OTel (like the Google ADK’s internal LLM calls) will automatically create its own spans as children of this active parent span.
Adding the FinOps Metadata (Tags):
span.set_attribute("finops.team_id", team_id)
span.set_attribute("finops.project_code", project_code)
We inject the cost center details right here! Since the ADK’s internal spans (which contain the token counts) are children of this span, your trace backend will see all token usage directly under the finops.project_code. Allocation solved!
The Critical FinOps Metrics
def setup_opentelemetry_tracer():
    """Configures the Tracer to output to the console for a runnable demo."""

    # 1. Create a TracerProvider
    provider = TracerProvider()

    # 2. Add a simple processor that exports traces to the console
    # This shows the raw trace data and attributes!
    provider.add_span_processor(SimpleSpanProcessor(ConsoleSpanExporter()))

    # 3. Set it as the global provider
    trace.set_tracer_provider(provider)

    return trace.get_tracer("finops.adk.agent")
The ConsoleSpanExporter output is your immediate cost report. Look for the nested LLM call span to find the complete, billable picture (The finops.* attributes are set by the example code, while the llm.* attributes and metrics are coming from the ADKs LLMAgent ):
Advanced FinOps: Passing Spans in Multi-Agent Flows
What about complex workflows where one agent delegates work to another? This is where the power of OpenTelemetry shines.
- In the OTel model, when an agent (the parent) calls another agent or tool (the child), the trace context of the parent span is automatically carried down the call chain.
- The entire sequence of agents and tools executes within the initial FinOps Span context.
- This means your single, top-level FinOps tag covers the entire, complex, multi-step agent choreography — you get one unified, auditable cost report for the whole workflow! This feature is inherited from the standard OTel instrumentation used by ADK.
Links
For further reading on the foundation that makes this FinOps solution possible:
Confirms ADK’s native, built-in support for OpenTelemetry instrumentation.
Getting Started with OpenTelemetry
Explains the underlying principles of Spans, Context, and Context Propagation.
Details the types of agents (LlmAgent, SequentialAgent) that benefit from this tracing.
In the next post we’ll cover how to introduce effective cost guardrails for your AI applications.