
Modern cloud-native applications rarely scale perfectly using CPU or memory metrics alone. Many workloads are driven by signals like request rate, queue depth, GPU usage, or application latency. Traditional autoscaling approaches struggle to capture these signals, which often leads to inefficient scaling decisions.
Google Kubernetes Engine (GKE) recently introduced native support for custom metrics, simplifying how applications expose metrics and enabling more intelligent autoscaling decisions without complex adapters or additional infrastructure.
In this article, we will explore:
- The challenges with traditional autoscaling approaches
- How GKE’s native custom metrics support addresses those challenges
- How the new feature works internally
- A practical example demonstrating custom-metric–based autoscaling
⚠️ Note: This feature is currently in Preview, available on GKE 1.35.1-gke.1396000 or later in the Rapid channel only. Check the official docs for the latest GA status before adopting in production.
The Problem with Traditional Autoscaling
Autoscaling in Kubernetes typically relies on the Horizontal Pod Autoscaler (HPA). By default, HPA scales workloads based on resource utilization, such as CPU or memory. While this works well for many workloads, it doesn’t always reflect the real demand placed on an application.
For example:
- A web API may experience heavy request traffic without high CPU utilization.
- A queue-processing service may need more workers when the backlog grows.
- AI inference workloads may depend more on GPU usage than on CPU.
- Streaming services may need scaling based on requests per second.
These scenarios require scaling based on application-level metrics, not infrastructure metrics.
Kubernetes supports autoscaling based on custom metrics, but historically implementing this required additional components such as:
- Prometheus adapters — a separate deployment that bridges Prometheus metrics to the Kubernetes metrics API
- Custom metric pipelines — ingestion, storage, and query layers that sit between your app and the HPA
- Complex IAM and service account configuration — especially in managed environments like GKE

Source: Gemini Nano Banana Pro
The operational burden of these components was high, as teams managed adapter compatibility across Kubernetes versions, debugged multi-hop metric pipelines, and handled latency from infrastructure layers. This friction slowed adoption, leading many teams to revert to CPU-based scaling.
Native Custom Metrics Support in GKE
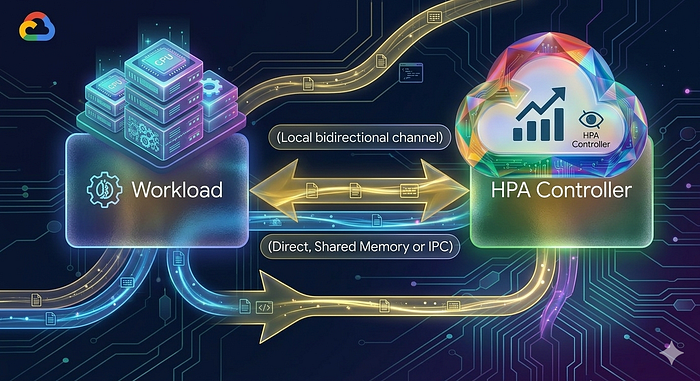
GKE now provides native integration for exposing custom metrics, simplifying how applications share metrics with the autoscaling system. Instead of routing metrics through external adapters and monitoring systems, custom metrics are now collected directly from pods and fed into the HPA.
This enables the autoscaling system to react to actual application behavior, such as request throughput or resource utilization. This significantly simplifies the process of integrating application metrics into scaling strategies.
Source: Gemini Nano Banana Pro
How the Solution Works
The new capability works through a resource called AutoscalingMetric.
This resource defines:
- Which pods expose the metrics (via label selectors)
- Where the metrics endpoint exists (port and path)
- Which specific metric should be collected
- How the metric should be exported to the autoscaling system
Once defined, GKE collects these metrics and makes them available to components such as the load balancer or autoscaler.
Key requirements include:
- Metrics must be available via an HTTP endpoint
- The format should follow Prometheus standards
- Only gauge metrics are supported.
- Maximum of 20 unique metrics can be exposed per cluster.
Gauge vs. other metric types: A gauge represents a value that can go up or down at any point in time (e.g., current queue length = 45). Counters only go up (e.g., total requests processed = 10,432) and are not suitable for direct autoscaling targets. If your application currently exposes counters, you will need to derive a gauge (e.g., derived request rate) before using it with this feature.
Once the metric is registered, GKE continuously reads it and feeds the value into scaling logic.
Example: Autoscaling Based on Queue Length
Let’s walk through a complete, self-contained example.
Scenario: A background worker service processes jobs from a queue. We want to scale the number of worker pods based on the current queue length — not CPU usage.
Step 1: Expose the Metric from the Application
Deploy your application that exposes a Prometheus-format gauge metric at its /metrics endpoint:
# HELP job_queue_length Current number of jobs waiting in the queue
# TYPE job_queue_length gauge
job_queue_length 45
Let’s assume the metrics are available at http://worker-service:9090/metrics
Step 2: Create an AutoscalingMetric Resource
Define an AutoscalingMetric resource that tells GKE where to find and how to export the metric:
apiVersion: autoscaling.gke.io/v1beta1
kind: AutoscalingMetric
metadata:
  name: worker-queue-metric
  namespace: default
spec:
  selector:
    matchLabels:
      app: job-worker #The label name and value matching the Pods
  endpoints:
  - port: 9090 #The metrics port number
    path: /metrics #The path to the metric
    metrics:
    - gauge:
      name: job_queue_length #The name of the metric that you are exposing.
      prometheusMetricName: job_queue_length #optional: The Prometheus metric name as exposed by the Pod.
Once applied, the metric becomes available to the autoscaling system.
Step 3: Configure the Horizontal Pod Autoscaler
Now we create an HPA that uses the custom metric.
apiVersion: autoscaling/v2
kind: HorizontalPodAutoscaler
metadata:
  name: worker-hpa
spec:
  scaleTargetRef:
    apiVersion: apps/v1
    kind: Deployment
    name: job-worker
  minReplicas: 2
  maxReplicas: 10
  metrics:
  - type: Pods
    pods:
      metric:
        name: autoscaling.gke.io|worker-queue-metric|queue_utilization
      target:
        type: AverageValue
        averageValue: 20
This configuration means:
- If the average queue size exceeds 20 jobs per pod, the system scales up.
- If the queue shrinks, the system scales down.
Benefits of Native Custom Metrics
This feature provides several key advantages.
- Application-Aware Scaling: Scaling decisions reflect real demand, not infrastructure proxies.
- Reduced Operational Complexity: No need for external adapters or complicated metric pipelines.
- Improved Performance: Applications scale more accurately and respond faster to workload spikes.
- Better Resource Utilization: Infrastructure costs decrease because scaling aligns with actual demand.
- Flexible Autoscaling Strategies: Teams can design policies around any gauge metric their application exposes, such as queue depth, active sessions, pending renders, and more.
GKE’s native custom metrics support removes a major obstacle that has traditionally made application-aware autoscaling difficult to implement. By removing the need for external adapters and Prometheus pipelines, teams can now connect scaling directly to the metrics that matter—queue depth, request rate, GPU saturation, or any gauge metric their application exposes.
If your workloads frequently encounter CPU or memory scaling blind spots, this feature is worth considering. If you’re already exploring a proof of concept or want to learn more about this feature, DoiT can help. Our team of 100+ experts specializes in tailored cloud solutions and is ready to guide you through the process and optimize your infrastructure to ensure compliance and meet future demands. Contact us today.
Useful Links: