
The problem with unexpected NAT Gateway traffic spikes
It can be challenging to deal with unexpected traffic spikes in AWS’s Network Address Translation (NAT) Gateways Service. While VPC Flow Logs provide valuable insights into network traffic, constantly recording them can lead to unnecessary storage costs and a deluge of data that might not be relevant during normal operations.
What if you could selectively enable VPC Flow Logs only when a surge in traffic is detected?
This blog post explores a solution that dynamically creates a temporary VPC Flow Logs recorder when a predefined traffic threshold is exceeded. This approach ensures cost-effectiveness by minimizing data storage while providing crucial information for investigating and understanding unexpected traffic patterns.
Why should we care about traffic going through NAT Gateways?
Using NAT Gateways comes with a cost. You pay for it to be up and running, which in the North Virginia Region is $0.045 per hour. You also pay for the volume of traffic going through it, $0.045 per GB in/out. It’s for everything that goes through the NAT Gateway, even for a regional resource such as S3.
This can add up quite fast, as for each TB of data, you will pay:
1,024GB x $0.045 = $46.08
For 10TB, it will be $460.
And so on.
This blog started because a customer asked for advice about unexpected traffic via NAT Gateway that randomly spiked to 35TB, costing them an additional and unexpected $1600 per spike. They had no idea why this was happening and didn’t want to activate VPC Flow Logs for the entire month (see below the section about VPC Flow Log costs to understand why).
How VPC Flow Logs work
To quote AWS’s documentation that explains this clearly:
VPC Flow Logs is a feature that enables you to capture information about the IP traffic going to and from network interfaces in your VPC. Flow log data can be published to the following locations: Amazon CloudWatch Logs, Amazon S3, or Amazon Data Firehose. After you create a flow log, you can retrieve and view the flow log records in the log group, bucket, or delivery stream that you configured.
Flow logs can help you with a number of tasks, such as:
\* Diagnosing overly restrictive security group rules
\* Monitoring the traffic that is reaching your instance
\* Determining the direction of the traffic to and from the network interfaces
Flow log data is collected outside of the path of your network traffic, and therefore does not affect network throughput or latency. You can create or delete flow logs without any risk of impact to network performance.
This blog and its accompanying repository refer to the traffic recording and ingesting it into a specified log group in Amazon CloudWatch Logs, in which all the traffic logs are kept and available for analysis.
By default, if you enable VPC Flow Logs for a NAT Gateway, the logs will have the following format and can be seen in their respective CloudWatch Log Group:
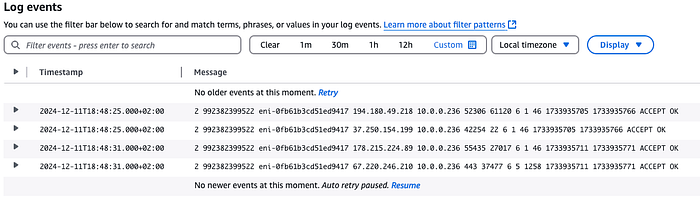
Typical Flow Logs recrds in CloudWatch Logs
The Cost of Continuous VPC Flow Log Recording
This blog refers to storing the recorded data in CloudWatch Log Groups, so it is important to understand the costs associated with data ingested into the logs. See the CloudWatch Logs pricing for reference here.
Let’s say you are using 10 NAT Gateways, each sending 1K requests per second from your services to the Internet and receiving only one reply for each such request. Recording this traffic with VPC Flow Logs will cause it to ingest 2000 records (1K sent + 1K from the response) per second into CloudWatch Logs via the VPC Flow Logs.
Let’s assume that each record’s size is 100 bytes (it can be fewer or more, depending on how detailed you want it to be). Every month, CloudWatch Logs will ingest records with a total size of:
10 (NAT Gateways) X 2000 (records per second) X 100 (bytes per record) X 86,400 (seconds per day) X 30.5 (average days per month) = 5,270,400,000,000 bytes.
So, around 5.2TB will be ingested per month.
The calculation of the cost of one month of ingesting this data is done based on the rate of $0.5 per GB for ingesting up to 10TB of data:
5200GB * 0.5 ($ per GB )= $2600 per month(It can be half, which is “only” $1300 if you ingest into a CloudWatch Logs Group set to Infrequent Access Log Class)
Now assume that the traffic spikes you want to catch happen only once or twice per month, last only 15 minutes, and pass a lot of data through the NAT Gateway during this time.
Note that the amount of data passed doesn’t necessarily mean more records will be created in the VPC Flow Log.
Consider, for example, the difference between passing a 10MB file or a 1KB file through a NAT Gateway. Each file transferred through a NAT Gateway will create only one record. The 10MB file won’t generate more than one VPC Flow Log record even though it is bigger than the 1KB file, which will also generate only one record.
The cost for the NAT Gateway traffic will jump by a factor of 10 ⁰⁴ due to the much higher traffic volume.
We want to capture these spikes without paying for a month of recording VPC Flow Logs.
Triggering Temporary VPC Flow Logs
The solution ensures that VPC Flow Logs are recorded when a NAT Gatway’s traffic surpasses a certain threshold. For instance, if the regular traffic pattern for a NAT Gateway is 10MB per minute, you could set an alarm to trigger when traffic exceeds 100MB per minute for a specific duration.
This solution won’t be practical for short-lived traffic spikes because VPC Flow Logs will only be created after such a spike is detected. Though the spike doesn’t need to be very long to be captured, it must be longer than 3 minutes to ensure it starts recording the traffic.
Solution Architecture
The solution creates a CloudWatch Alarm for each NAT Gateway you specify during installation.
These alarms are matched by an EventBridge Rule that fires a Step Function.
The Step Function is responsible for starting the VPC Flow Log recording for the NAT Gateway in alarm state. It then deletes the VPC Flow Logs recording process but leaves the recorded data. At the end of the recording, SNS sends an email to the address provided during installation.
The solution is implemented using AWS SAM and consists of two CloudFormation stacks. The first stack deploys CloudFormation macros to streamline the deployment process. These macros include:
- A macro to automatically generate CloudWatch alarms for each specified NAT Gateway, simplifying the configuration process.
- Another macro addresses a CloudFormation limitation of being unable to convert string parameters to integers.
The second stack creates the core components of the solution:
- DynamoDB Table: This table stores the count of recordings performed per NAT Gateway and holds a callback token used when the alarm returns to an “OK” state.
(A callback token is generated inside a Step Function’s Task. When this task executes, it waits to be notified before continuing to the next step. The Lambda function that is triggered by the alarm returning to an “OK” state reads it and uses it to “tell” the Step Function to stop waiting and resume operation).
This helps manage the recording process and ensures seamless resumption after an alarm is resolved.
- CloudWatch Alarms: These alarms monitor the specified NAT Gateways for traffic exceeding the defined threshold.
- EventBridge Rules: Two EventBridge rules are configured to orchestrate the workflow. One rule triggers a Step Function when the CloudWatch alarm is activated, while the other triggers a Lambda function when the alarm returns to “OK.” This event-driven approach ensures a timely response to traffic fluctuations.
- Step Function: The Step Function orchestrates creating, managing, and deleting VPC Flow Logs. It includes the following steps:
— Verification to ensure that the maximum number of desired recordings hasn’t been reached, preventing unnecessary recordings.
— Creation of VPC Flow Logs for each ENI associated with the NAT Gateway, capturing detailed traffic information.
— A wait state that pauses the workflow until either the alarm returns to “OK” or a predefined time limit is reached, ensuring that recording continues for a sufficient duration.
— Deletion of the VPC Flow Log configuration while preserving the recorded logs for the time chosen during the CloudFormation’s Stack deployment.
— Sending an SNS email notification to designated recipients providing timely updates on the recording status.
- Lambda Functions:
There are two functions. One is called from the Step Function to retrieve the NAT Gateway’s ENIs in alarm state and create the VPC Flow Logs for these ENIs. The other is triggered by the EventBridge Rule when the CloudWatch alarm returns to “OK.” It retrieves the Step Function’s callback token from DynamoDB and calls the Step Function to resume its operation.
The Step function’s structure can be seen here:

Efficient Log Storage and Analysis
This solution utilizes the CloudWatch Logs Group Infrequent Access storage class for storing VPC Flow Logs. This storage class offers a cost-effective option and allows efficient querying and analysis using CloudWatch Logs Insights.
Analyzing VPC Flow Log Data
At the end of a VPC Flow Logs recording session, an email with a deep link to the created VPC Flow Logs Group and the prefix of the recorded log streams is sent.
The solution provides a predefined query format for CloudWatch Logs Insights, enabling users to extract meaningful insights from the collected data. You can execute the following CloudWatch Logs Insight Query on the Flow Log by going to CloudWatch Logs Insights and choosing the query called “Serverless Auto VPC Flow Log Recorder” in the “Saved Queries” section to produce a human-readable output.
fields @timestamp, @message
| parse @message "* * * * * * * * * * * * * *" as action, flowDirection, trafficPathNum, srcAddr, srcPort, dstAddr, dstPort, proto, bytes, type, pkt_srcaddr, SrcService, pkt_dstaddr, DstService
| display @timestamp, action, flowDirection,
if(trafficPathNum == 1, "Through another resource in the same VPC",
if(trafficPathNum == 2, "Through an internet gateway or a gateway VPC endpoint",
if(trafficPathNum == 3, "Through a virtual private gateway",
if(trafficPathNum == 4, "Through an intra-region VPC peering connection",
if(trafficPathNum == 5, "Through an inter-region VPC peering connection",
if(trafficPathNum == 6, "Through a local gateway",
if(trafficPathNum == 7, "Through a gateway VPC endpoint (Nitro-based instances only)",
if(trafficPathNum == 8, "Through an internet gateway (Nitro-based instances only)",
"unknown")))))))) as trafficPath,
srcAddr, srcPort, dstAddr, dstPort,
if(proto == 6, "TCP",
if(proto == 17, "UDP",
proto)) as protocol,
bytes, type, pkt_srcaddr, SrcService, pkt_dstaddr, DstService
| sort @timestamp desc
| limit 1000
Below is an example of the output from this query, showing that the VPC S3 Gateway Endpoint wasn’t set in the VPC. As a result, traffic to S3 goes through the NAT Gateway and the Internet.
Identifying Traffic Routed Through the Internet
The solution also highlights the ability to identify traffic flowing via the Internet instead of VPC endpoints. Suppose traffic is directed to an AWS Service via the Internet. In that case, the service name appears under the SrcService or DstService fields in the CloudWatch Logs Insights output (see the above example for traffic going to the S3 Service). This information helps determine if VPC endpoints should be configured for specific services to enhance security and reduce costs.
Accompanying GitHub Repository
You can review and follow the installation instructions for this solution in this GitHub Repository.
Call to Action
I trust this blog post has provided valuable insights. If you’d like to know more or are interested in our services, don’t hesitate to get in touch. You can contact us here
Additional References
February 2025 Update
The associated Github repository has a new branch called JSONata. it contains a new updated Step Function ASL that uses JSONata and variables for smaller, clearer, and smarter code. The ASL itself was extracted from the SAM YAML Template to its own JSON file referenced from the Template.
The suggested solution only records metadata for traffic passing through NAT Gateways when the traffic’s volume surpasses a certain threshold, reducing costs and logging of irrelevant data. A Serverless solution further reduces the costs by ensuring that you don’t pay as long as nothing is being recorded.