DoiT Cloud Intelligence™
Proactively Detect Network Misconfigurations in Google Cloud with Network Analyzer

Photo by T.Dallas from Shutterstock
In today’s digital landscape, cloud computing plays a pivotal role in powering businesses and applications. This makes the robustness and reliability of network configurations paramount.
Google Cloud Platform (GCP) offers many services and features to build and manage complex network infrastructures, allowing businesses to scale and innovate seamlessly. However, with great power comes great responsibility, and ensuring that your Google Cloud Platform (GCP) network is configured correctly and securely is critical.
Imagine a scenario where a simple misconfiguration in your Google Cloud Platform (GCP) Virtual Private Cloud (VPC) leads to security vulnerabilities, network bottlenecks, or unnecessary cost overheads. Detecting and rectifying such issues after they’ve caused problems can be time-consuming and costly.
This is where proactive network analysis and tools like Network Analyzer come into play. In this blog post, we will discuss how to use Google Cloud Platform (GCP) Network Analyzer to proactively detect network misconfigurations.
Network Analyzer
Network Analyzer is part of the Network Intelligence Center and a fully managed service that automatically monitors the Virtual Private Cloud (VPC) network configurations and detects misconfigurations and suboptimal configurations that might have been unintentionally deployed.
It provides insights about network topology, firewall rules, routes, configuration dependencies, and connectivity to services and applications. It identifies network failures, provides root cause information, and suggests possible resolutions.
Network Analyzer runs continuously and triggers relevant analyses based on near real time configuration updates in your network. If a network failure is detected, it tries to correlate the failure with recent configuration changes to identify root causes. Wherever possible, it provides recommendations to suggest details about how to fix the issues.
Insights from Network Analyzer
The results from Network Analyzer analyses are known as insights. The insights are currently grouped into 5 categories:
- VPC network: Covers basic VPC network setup and configuration issues, such as information about or issues with IP addresses, routes, firewall rules, VPC peering, and shared VPC.
- Network services: Covers load balancer related issues like firewall rules blocking health checks, backend service uses different ports for health checks and traffic. Also provides informational insights suggesting best practices.
- Kubernetes Engine: Covers GKE related networking issues that can impact GKE operation and connectivity. It also analyzes the IP utilization of GKE pods and runs various checks to verify the implementation of best practices for GKE clusters.
- Hybrid connectivity: Lists hybrid connectivity related issues and information suggesting best practices for Cloud VPN, Cloud Interconnect, Cloud Router, BGP peering, dynamic routes, and Network Connectivity Center (NCC).
- Managed services: Lists connectivity issues with Google-managed services. Network Analyzer supports detecting connectivity issues from an IP address in the same network and region to managed services such as Cloud SQL instances with a private IP address.
Refer to the complete list of analyzers here, and Google Cloud Platform (GCP) is continuously adding new analyzers to this module.
Enable Network Analyzer
The network analyzer is automatically activated on new projects. It uses the Network Management Service Agent role to read certain network configurations that are used for discovering GKE on-premises to control plane connectivity insights.
You need to manually enable the network management API networkmanagement.googleapis.com in the target project to discover these insights.
In order to view multiple projects on Network Analyzer, you must first create a metrics scope. Once you have created the scope, you can add the projects that you want to monitor to it. By doing this, you will be able to monitor the data for both the scoping project and the monitored projects simultaneously. This will allow you to keep track of all the important information in one place.
User permissions
- Single project: To access the analysis results of a project assign
compute.networks.listandcompute.instances.listpermissions. - Multiple projects: If you have configured Cloud Monitoring metrics scope then assign
compute.networks.listandcompute.instances.listpermissions on the scoping project.
Pricing
Currently, the Network Analyzer module is available to all users free of charg e. Although the module’s cost may be visible in your billing details, you will not be billed for it. If any changes are made to the discount structure, you will receive a notification 90 days prior to the implementation of the changes.
Network analyzer in action
You can view the network analyzer insights in the Google Cloud Console under Network Intelligence Center -> Network analyzer or Use the Recommender CLI / API.
- It may take up to 10–20 minutes for the updated information to display in the console, and you also force regenerate insights by clicking Update.
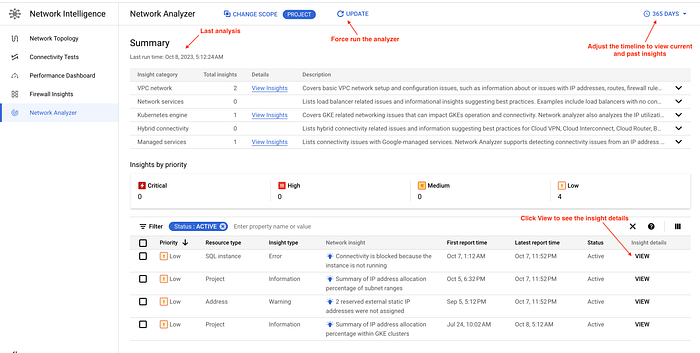
Sample network analyzer summary view
- Click the view option to see the insight details. It identifies the root cause of the insight and provides a link to the documentation with recommendations to fix the insight.
The sample insights summary is displayed in the screenshots below.
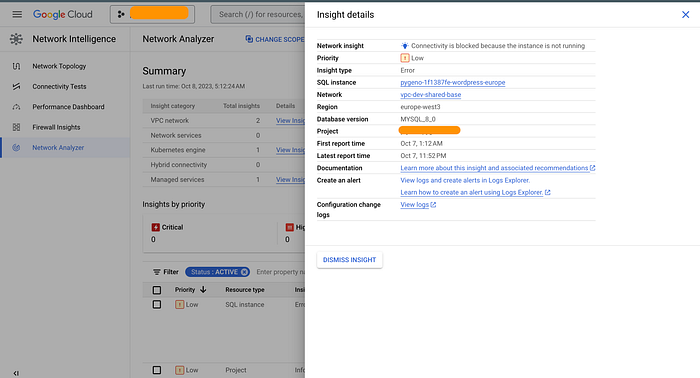
Sample insight Summary of SQL instance connectivity issues
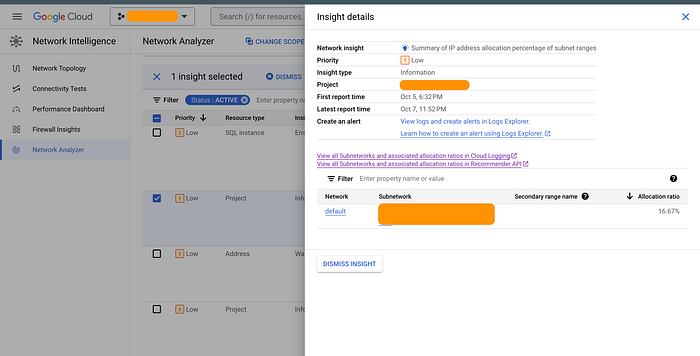
Sample insight Summary of IP address allocation percentage of a subnet
Logging and Alerting
Cloud Logging stores insights published by the Network Analyzer. Log names are formatted as follows:
projects/{project-id}/logs/networkanalyzer.googleapis.com%2Fanalyzer_reports
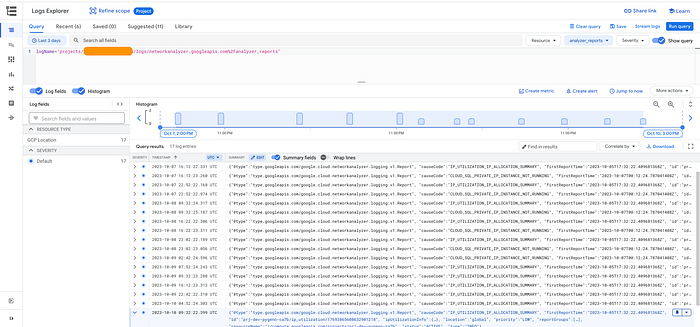
Sample Network Analyzer logs in Cloud Logging
Network Analyzer is not publishing any metrics to Cloud monitoring, but you can use the log queries to set up log-based alerts to notify you when the matching insights are discovered by Network Analyzer.
Refer to log queries for some examples of log queries for specific Network Analyzer insights and log-based alerts for example alert setup.
Network Analyzer is an invaluable tool for organizations that aim to proactively manage their Google Cloud Platform (GCP) network. It can help you detect and resolve network issues and misconfigurations before they impact your business operations. When used in conjunction with logging and monitoring, it can provide real time insights and alerts, enabling you to stay on top of potential issues and take immediate action.