
VPC flow logs is a feature provided by cloud services like Amazon Web Services (AWS) to capture information about the IP traffic going to and from network interfaces in a Virtual Private Cloud (VPC). These logs are used for network monitoring, security analysis, and troubleshooting. When enabled, they provide data such as the source, destination, and protocol of the traffic, as well as the number of bytes transferred. This information is critical for understanding network activity in a VPC and is often used to detect abnormal traffic patterns or potential security threats.
VPC flow logs is a feature provided by AWS to capture information about the IP traffic. By analyzing these logs, administrators can identify malicious activities like network reconnaissance, unauthorized data exfiltration, and unexpected traffic patterns. They also help in ensuring compliance with network policies and regulations. For instance, organizations can use flow logs to verify that their network configurations align with their security standards and regulatory requirements. Additionally, these logs are valuable for performance analysis, helping administrators optimize network traffic and resource allocation within the VPC.
There are multiple AWS Services that can be used to query VPC flow logs like Amazon Athena, Amazon CloudWatch Logs, AWS ElasticSearch Service, Amazon QuickSight, AWS Glue, Amazon Redshift. In this blog I will explain how to setup the Athena and S3 integration using AWS Cloud Formation.
AWS Athena is an interactive query service that allows you to analyze data directly in Amazon S3 using standard SQL. You can use Athena to query VPC flow logs that are stored in S3 buckets. This is useful for complex queries and ad-hoc analysis, as Athena is serverless and doesn’t require you to set up any infrastructure.
Previously the Athena setup was quiet complex and manual setting up S3 as a data source. Also when querying the logs you had to write the queries yourself to get the correct data. AWS made this process easy by providing a way to generate CloudFormation template along with multiple predefined queries that provides quiet detailed insights regarding traffic flow.
This is how you set it up:
Step 1: Enable VPC flow Logs
Below are all the selections you need to enable VPC flow logs. Once enabled navigate to the S3 bucket you selected to check if logs are coming in.
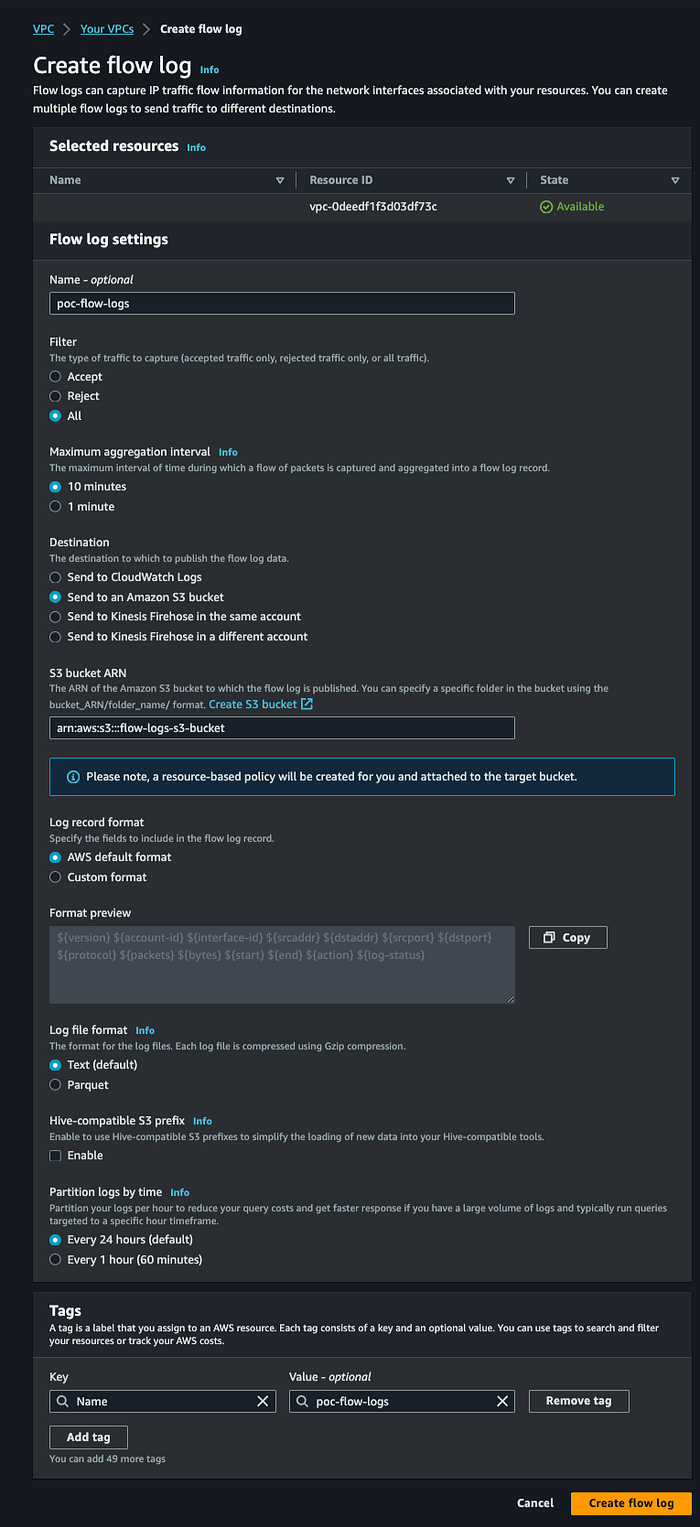
Enable VPC Flow Logs
Step 2 : Generate the CloudFormation template using the console
Navigate to your VPC and on the Flow logs tab, select a flow log that publishes to Amazon S3 and then choose Actions, Generate Athena integration.
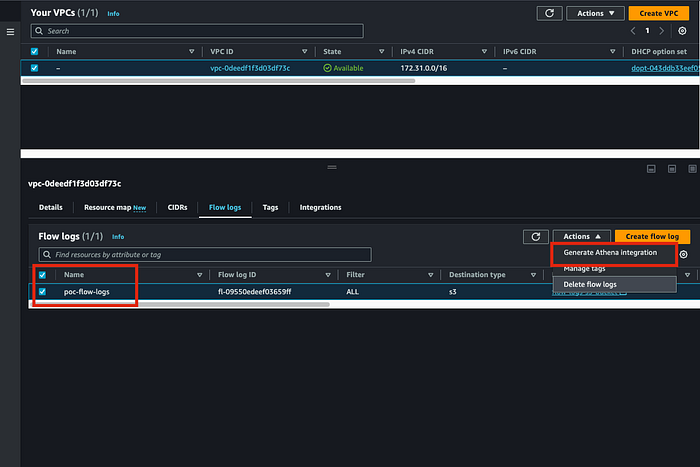
Generate Athena Integration
After you click on Generate Athena Integration in the next section you fill out the relevant details. I have used the same S3 bucket for CloudFormation template and Query Results. But you can use separate buckets too.
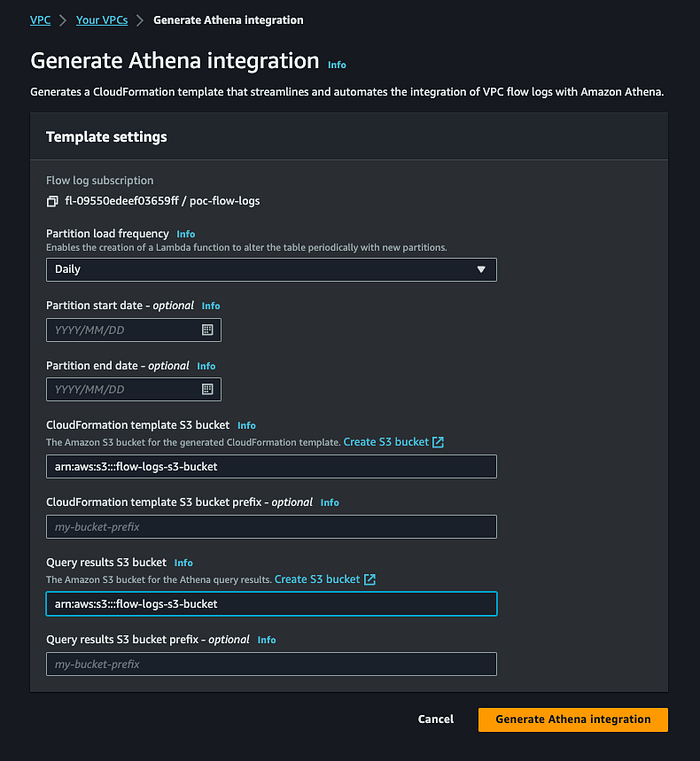
Generate Athena Integration S3 Bucket Selection
Step 2 : Create CloudFormation Stack
Once you click on “Generate Athena Integration” in next page you can Create CloudFormation stack by clicking on the “ Create CloudFormation stack” button on top right. Be careful do not close that green popup or you will have to do the above process again.
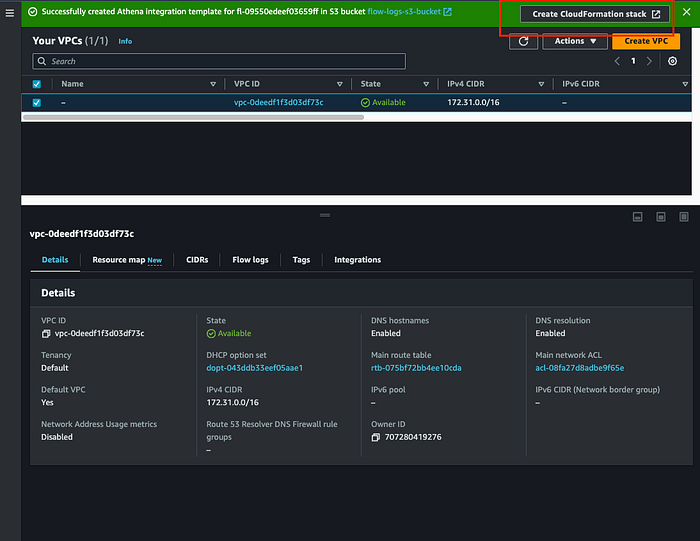
Create CloudFormation Stack 1
Once you click on “Create CloudFormation Stack” you will be taken to the AWS CloudFormation page.
Just click Next in that page.
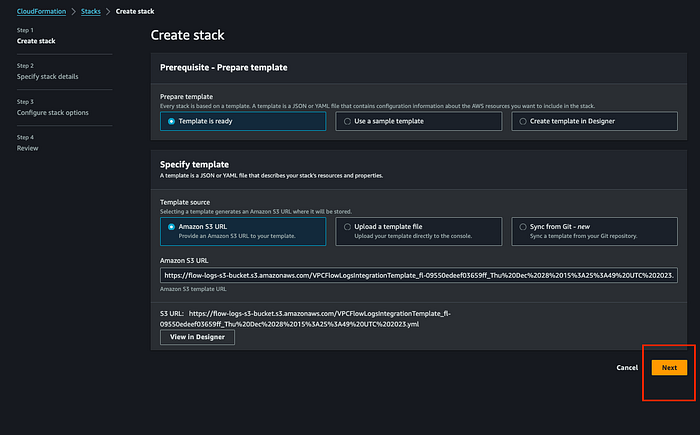
Create CloudFormation Stack 2
Mention the stack name of your choice click Next.
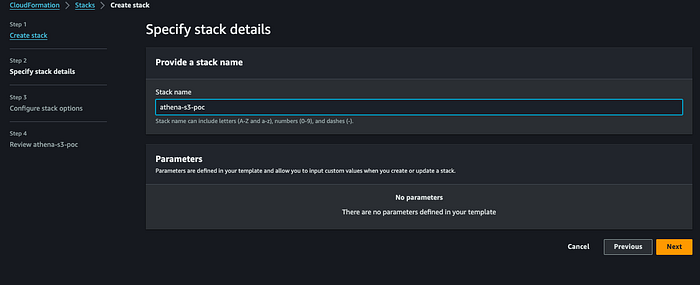
Create CloudFormation Stack 3
In the next window keep all the selections the same and click Next.
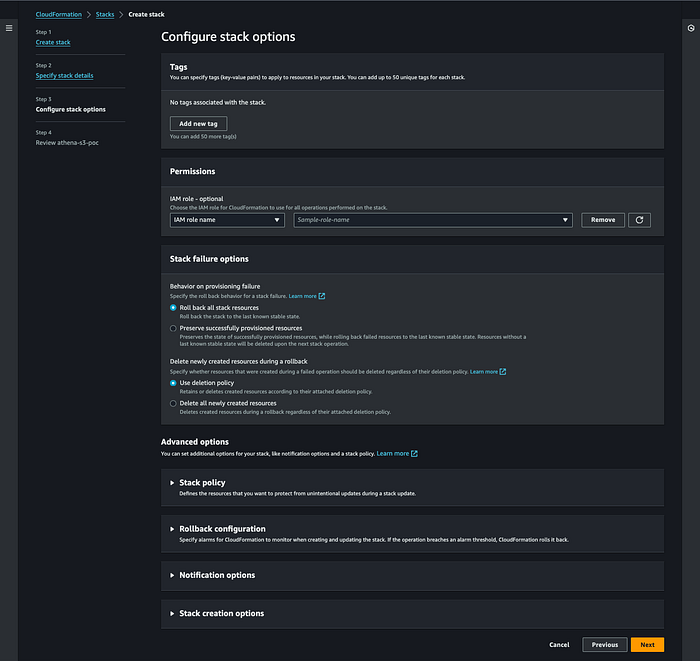
Create CloudFormation Stack 4
Review all your selections are correct select the checkbox of I acknowledge and Submit.
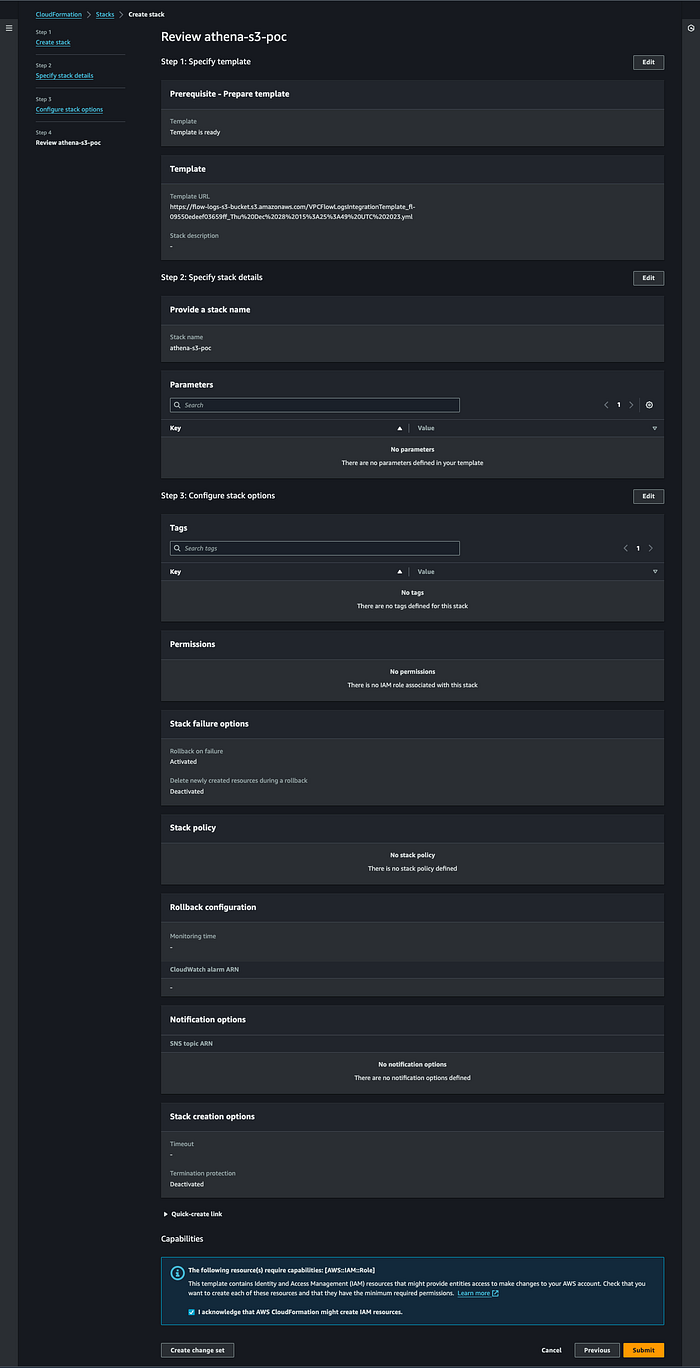
Create CloudFormation Stack 5
Wait for the stack to be completed.
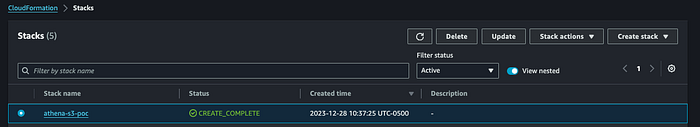
Create CloudFormation Stack 6
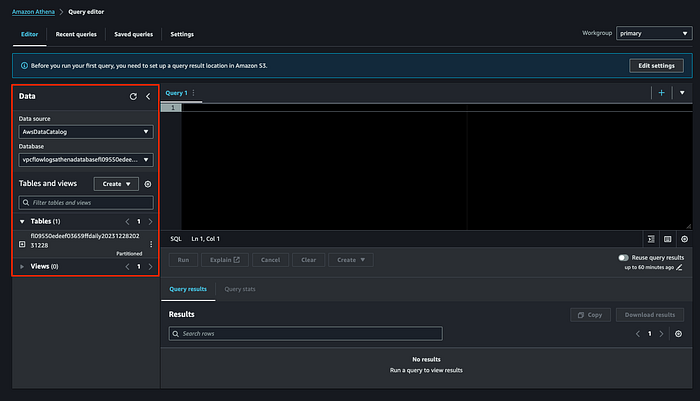
Once the stack is created go to Athena and you will see the VPC Flow Log Database created and ready to be queried using Athena. If you see the warning for query result location just click “Edit Settings” and select the bucket where you want to save the query results. I selected the same S3 bucket I created for the VPC Flowlogs.
Create CloudFormation Stack 7
Step 3: Run a predefined query
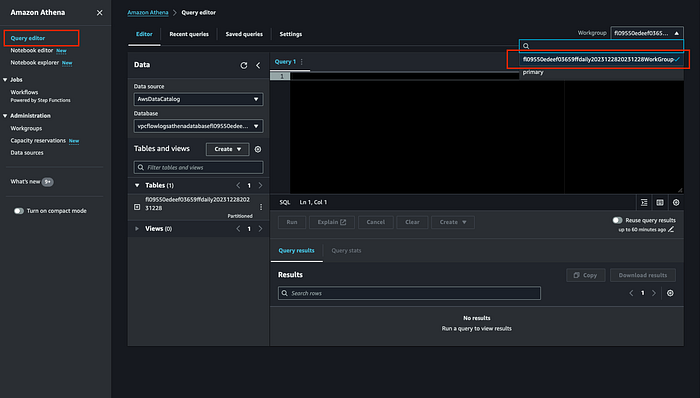
In the Athena select Query Editor on the left navigation and select the workgroup that was created by our CloudFormation template.
Run a predefined query 1
Now when you click on Saved queries you will find multiple populated queries along with there description on that insights they provide.
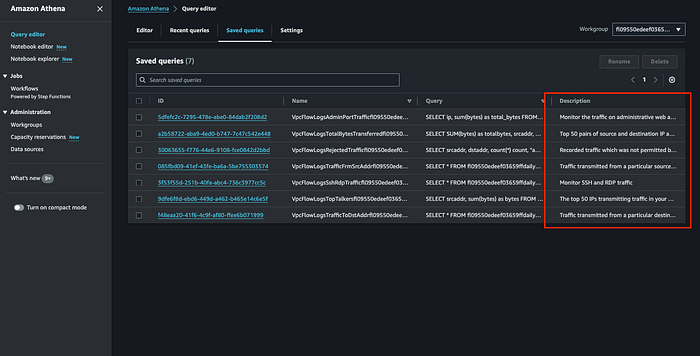
Run a predefined query 2
In my screenshot above you can see less queries because I am using my sandbox account but depending on the logs your VPC flow logs have you will be able to see multiple queries. Below is list of the queries that are provided.
- VpcFlowLogsAcceptedTraffic — The TCP connections that were allowed based on your security groups and network ACLs.
- VpcFlowLogsAdminPortTraffic — The top 10 IP addresses with the most traffic, as recorded by applications serving requests on administrative ports.
- VpcFlowLogsIPv4Traffic — The total bytes of IPv4 traffic recorded.
- VpcFlowLogsIPv6Traffic — The total bytes of IPv6 traffic recorded.
- VpcFlowLogsRejectedTCPTraffic — The TCP connections that were rejected based on your security groups or network ACLs.
- VpcFlowLogsRejectedTraffic — The traffic that was rejected based on your security groups or network ACLs.
- VpcFlowLogsSshRdpTraffic — The SSH and RDP traffic.
- VpcFlowLogsTopTalkers — The 50 IP addresses with the most traffic recorded.
- VpcFlowLogsTopTalkersPacketLevel — The 50 packet-level IP addresses with the most traffic recorded.
- VpcFlowLogsTopTalkingInstances — The IDs of the 50 instances with the most traffic recorded.
- VpcFlowLogsTopTalkingSubnets — The IDs of the 50 subnets with the most traffic recorded.
- VpcFlowLogsTopTCPTraffic — All TCP traffic recorded for a source IP address.
- VpcFlowLogsTotalBytesTransferred — The 50 pairs of source and destination IP addresses with the most bytes recorded.
- VpcFlowLogsTotalBytesTransferredPacketLevel — The 50 pairs of packet-level source and destination IP addresses with the most bytes recorded.
- VpcFlowLogsTrafficFrmSrcAddr — The traffic recorded for a specific source IP address.
- VpcFlowLogsTrafficToDstAddr — The traffic recorded for a specific destination IP address.
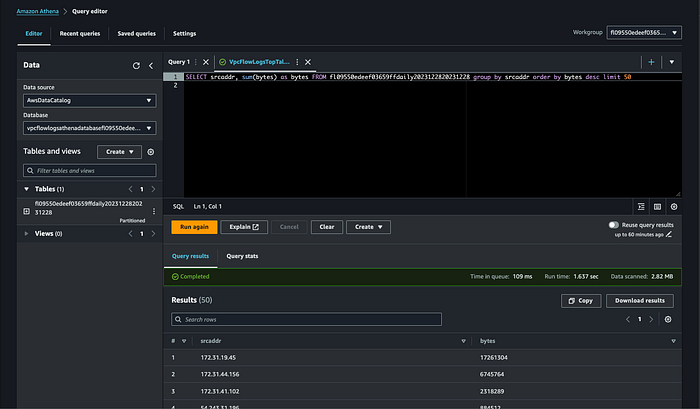
Lets run one sample query to get a gist of what insights they provide. I used this query VpcFlowLogsTopTalkers that will provide top 50 IP address with the amount of data transfer bytes they consumed.
And we are done. Now we have query mechanism in place to troubleshoot or get insights into issues related to your network.
Happy Troubleshooting !!!
Reference:
[1] https://docs.aws.amazon.com/vpc/latest/userguide/flow-logs-athena.html