
A practical, low-cost POC you can run in a weekend — with clear Azure-first deployment steps

image generated by AI (chatgpt5.0)
TL;DR
- Identity: Make Microsoft Entra ID your single source of truth for humans. Bridge it to any Kubernetes (AKS/EKS/GKE) using Pinniped (Supervisor + Concierge) so all clusters accept Entra sign‑in.
- Observability: Instrument apps/infra with OpenTelemetry → ship to Azure Monitor / Log Analytics.
- Detection: Use KQL time-series ML (without custom models) to identify and detect service anomalies.
- Action: Wire Azure Monitor alerts to Logic Apps/Azure Functions for safe and auditable remediation.
Outcome: one auth plane , one observability fabric , faster MTTR , and pragmatic zero‑trust controls — without standing up ML infra.
Who this is for
Platform, SRE, and security architects running multi‑cloud Kubernetes (AKS/EKS/GKE) who want:
- A centralized, auditable human identity plane
- Standardized telemetry across clouds
- Cost‑conscious anomaly detection and safe automation
What problems does this solve?
- Fragmented user auth across AKS/EKS/GKE → drift and toil.
- Siloed telemetry → inconsistent detection and slow incident response.
- Spinning up ML stacks is costly and overkill for many signals.
Goal: A repeatable pattern that (1) centralizes identity, (2) standardizes telemetry, (3) detects with lightweight KQL ML, and (4) automates guarded remediation.
Architecture at a glance
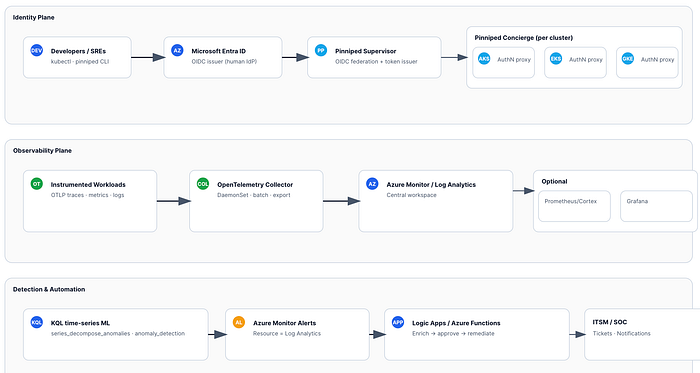
- Entra ID (IdP) → Pinniped Supervisor (OIDC issuer/federation) → Pinniped Concierge (per cluster).
- Developers sign in with Entra once and obtain short-lived Kubernetes tokens for AKS/EKS/GKE.
- App/infra telemetry via OpenTelemetry SDKs/auto‑instr → OpenTelemetry Collector (DaemonSet) → Azure Monitor / Log Analytics (central workspace). Optional: metrics remote_write to Prometheus/Cortex and dashboards in Grafana.
- KQL
series_decompose_anomalies/anomaly_detectionfor identity + service anomalies → Azure Monitor Alerts → Logic App/Azure Function for enrichment and remediation.
Policy & automation (optional)
- Kyverno/OPA Gatekeeper for admission/runtime policy; Azure Monitor alerts → Logic App / Azure Function for orchestrated remediation (ticketing, Conditional Access, quarantine).
Azure‑first prerequisites (POC scope)
- Subscription & Resource Group for monitoring and shared services.
- Log Analytics Workspace (central).
- (Optional) Application Insights (if you prefer AI‑based app telemetry views on top of LA).
- Microsoft Entra tenant with permissions to create App Registrations.
- Azure Key Vault for secrets (Entra app client secret; optional connection strings).
- kubectl + access to at least one cluster (AKS for the Azure walkthrough; EKS/GKE covered later).
- Helm for Pinniped and OpenTelemetry Collector.
Tip: Keep names/locations consistent (e.g.,
rg-plat-shared,law-plat-central).
Quick Azure deployment — step by step
This section guides you from zero to signals and alerts, with a focus on Azure. Afterward, extend to EKS/GKE.
1) Create core monitoring resources
Option A — Azure CLI
# Variables
LOC=westeurope
RG=rg-plat-shared
LAW=law-plat-central
az group create -n $RG -l $LOC
az monitor log-analytics workspace create -g $RG -n $LAW -l $LOC# Grab workspace info for later
LAW_ID=$(az monitor log-analytics workspace show -g $RG -n $LAW --query id -o tsv)
LAW_CUST_ID=$(az monitor log-analytics workspace show -g $RG -n $LAW --query customerId -o tsv)
LAW_KEY=$(az monitor log-analytics workspace get-shared-keys -g $RG -n $LAW --query primarySharedKey -o tsv)
Option B — Bicep (idempotent)
param location string = 'westeurope'
param rgName string = 'rg-plat-shared'
param workspaceName string = 'law-plat-central'
resource law 'Microsoft.OperationalInsights/workspaces@2022-10-01' = {
  name: workspaceName
  location: location
  properties: {
    retentionInDays: 30
    features: {
      searchVersion: 1
    }
  }
}
Retention drives cost. Start with 30d and adjust per compliance.
2) Export Entra sign‑in/audit logs to Log Analytics
- In Entra admin center → Monitoring & health → Diagnostics settings → Add → send SigninLogs and AuditLogs to the Log Analytics Workspace you created.
- Ensure the setting is enabled and logs are flowing by querying
SigninLogs | take 5after 10–15 minutes.
3) Register the Entra app for Pinniped Supervisor
- App Registration: grant
openid,profile,email,offline_access. - Add Redirect URI for the Supervisor callback (e.g.,
https://pinniped.<your-domain>/callback). - Create a client secret → store in Key Vault.
- Note Tenant ID, Client ID.
4) Deploy Pinniped on AKS (Supervisor + Concierge)
You can run the Supervisor in a small shared control cluster (recommended), and deploy Concierge to each workload cluster (AKS/EKS/GKE).
Install Supervisor (Helm)
helm repo add pinniped https://pinniped.dev/helm-charts
helm repo update
kubectl create ns pinniped-supervisor
helm upgrade --install pinniped-supervisor pinniped/supervisor \
  -n pinniped-supervisor \
  --set service.type=LoadBalancer \
  --set config.generateTLS=true
Create FederationDomain (link to Entra)
apiVersion: authentication.supervisor.pinniped.dev/v1alpha1
kind: FederationDomain
metadata:
  name: entra-domain
  namespace: pinniped-supervisor
spec:
  identityProviders:
  - name: azuread
    type: OIDC
    oidc:
      issuer: "https://login.microsoftonline.com/<TENANT_ID>/v2.0"
      clientID: "<CLIENT_ID>"
      clientSecret: { name: "pinniped-azure-secret" }
  issuer: https://pinniped.<your-domain> # public Supervisor URL
Store the Entra client secret as a Kubernetes secret named
pinniped-azure-secretinpinniped-supervisor.
Install Concierge in AKS cluster(s)
kubectl create ns pinniped-concierge
helm upgrade --install pinniped-concierge pinniped/concierge \
  -n pinniped-concierge \
  --set credentialIssuer.enable=true
Validate dev login
- From a developer laptop:
pinniped login oidc --issuer https://pinniped.<your-domain> --ca-bundle <CA.pem> - Confirm a kubeconfig with short‑lived tokens is produced and that
kubectl get podsworks against AKS.
Repeat Concierge install for EKS/GKE to unify sign‑in across clouds.
5) Deploy OpenTelemetry Collector to AKS (export to Azure Monitor)
Helm (generic collector)
helm repo add open-telemetry https://open-telemetry.github.io/opentelemetry-helm-charts
helm repo update
kubectl create ns observability
cat <<'EOF' > values-otel.yaml
config:
  receivers:
    otlp:
      protocols:
        grpc: {}
        http: {}
  processors:
    batch: {}
    resourcedetection:
      detectors: [env, k8snode, k8scluster, k8s]
  exporters:
    azuremonitor:
      connection_string: "InstrumentationKey=<APP_INSIGHTS_KEY>;IngestionEndpoint=https://<region>.in.applicationinsights.azure.com/"
  service:
    pipelines:
      traces:
        receivers: [otlp]
        processors: [batch, resourcedetection]
        exporters: [azuremonitor]
      metrics:
        receivers: [otlp]
        processors: [batch, resourcedetection]
        exporters: [azuremonitor]
      logs:
        receivers: [otlp]
        processors: [batch, resourcedetection]
        exporters: [azuremonitor]
EOFhelm upgrade --install otel-collector open-telemetry/opentelemetry-collector -n observability -f values-otel.yaml
Where do I get the connection string? In Azure, open your Application Insights resource → Overview → Connection string . You can send directly to Log Analytics via Data Collection Endpoints/Rules, but AI is the simplest on‑ramp for app traces.
Tag & sample telemetry
- Add resource attributes:
service.name,service.namespace,deployment.environment,team,costCenter. - Start with tail‑based sampling (10–20%) for traces; keep 1–5m resolution for metrics
A. Identity anomaly (spikes) — exclude noise, add “impossible travel”, and dimension by user
What’s new:
- Excludes service/break-glass accounts
- Uses a 7-day rolling baseline with 24h seasonality
- Adds geo enrichment + optional impossible-travel check
- Emits a clean payload ready for alert routing
// ---- Parameters
let lookback = 14d;
let baseline = 7d;
let binSize = 1h;
let sensitivity = 95;          // 90–99; higher = fewer alerts
let serviceAccounts = dynamic(["svc_", "automaton@", "spn-"]);  // prefixes/markers to exclude
// ---- Main
SigninLogs
| where TimeGenerated > ago(lookback)
| where ResultType != 0                      // failures only
| extend UPN = tostring(UserPrincipalName)
| where not(UPN has_any (serviceAccounts))  // exclude svc/breakglass
| summarize failed=count(),
           ips = make_set(IPAddress, 4),
           apps = make_set(AppDisplayName, 4)
    by UPN, bin(TimeGenerated, binSize)
| make-series failedSeries = avg(failed)
    on TimeGenerated from ago(baseline) to now() step binSize by UPN
| extend decomp = series_decompose(failedSeries, 24)        // model daily pattern
| extend anomalies = series_decompose_anomalies(failedSeries, sensitivity, 24)
| mv-expand TimeGenerated to typeof(datetime),
           failedSeries to typeof(double),
           decomp to typeof(dynamic),
           anomalies to typeof(double)
| where anomalies > 0
// ---- Optional geo + impossible travel
| join kind=leftouter (
    SigninLogs
    | where TimeGenerated > ago(lookback)
    | summarize arg_max(TimeGenerated, *) by UserId, IPAddress
    | project UserPrincipalName, IPAddress, Country = LocationDetails.countryOrRegion, Latitude = todouble(LocationDetails.geoCoordinates.latitude), Longitude = todouble(LocationDetails.geoCoordinates.longitude)
) on $left.UPN == $right.UserPrincipalName
| project TimeGenerated, UPN, failed=failedSeries, IPs=ips, Apps=apps, Country, Latitude, Longitude, anomalyScore=anomalies
| order by anomalyScore desc
Optional “impossible travel” add-on (pairwise geo jumps > 1,500 km in < 2 h):
let minKm = 1500.0;
let maxHours = 2.0;
let toRad = (d:real) { d * pi() / 180.0 };
let haversine = (lat1:real, lon1:real, lat2:real, lon2:real) {
    let dlat = toRad(lat2 - lat1);
    let dlon = toRad(lon2 - lon1);
    let a = pow(sin(dlat/2),2) + cos(toRad(lat1)) * cos(toRad(lat2)) * pow(sin(dlon/2),2);
    6371.0 * 2 * asin(sqrt(a))  // km
};
SigninLogs
| where TimeGenerated > ago(lookback) and ResultType == 0
| project UPN = UserPrincipalName, TimeGenerated, Lat = todouble(LocationDetails.geoCoordinates.latitude), Lon = todouble(LocationDetails.geoCoordinates.longitude)
| where isnotempty(Lat) and isnotempty(Lon)
| serialize
| extend prevTime = prev(TimeGenerated), prevLat = prev(Lat), prevLon = prev(Lon), prevUPN = prev(UPN)
| where UPN == prevUPN
| extend hrs = real(datetime_diff("minute", TimeGenerated, prevTime)) / 60.0
| extend km = haversine(prevLat, prevLon, Lat, Lon)
| where hrs > 0 and km / hrs > (minKm / maxHours)
| project TimeGenerated, UPN, km, hrs, speedKmh = km/hrs
Tip: keep identity anomaly and impossible travel as separate alerts ; route the latter to higher severity.
B. Service anomalies — align to your data tables, and add error rate + SLO burn
If you send app telemetry via Application Insights (common with OTel→Azure Monitor), replace Perf with these richer tables:
p95 latency spike (App Insights / OTel)
let window = 7d;
let step = 5m;
requests
| where timestamp > ago(window)
| summarize p95 = percentile(duration, 95) by bin(timestamp, step), cloud_RoleName
| make-series p95Series = avg(p95) on timestamp from ago(window) to now() step step by cloud_RoleName
| extend anomalies = series_decompose_anomalies(p95Series, 95, 24)
| mv-expand timestamp to typeof(datetime), p95Series to typeof(real), anomalies to typeof(double)
| where anomalies > 0
| project timestamp, service=cloud_RoleName, p95_ms = toreal(p95Series), anomalyScore = anomalies
| order by anomalyScore desc
Error-rate spike (more actionable than pure latency)
let window = 24h;
let step = 5m;
requests
| where timestamp > ago(window)
| summarize total=count(), errors = countif(success == false) by bin(timestamp, step), cloud_RoleName
| extend errRate = todouble(errors)/todouble(total)
| make-series errSeries = avg(errRate) on timestamp from ago(window) to now() step step by cloud_RoleName
| extend anomalies = series_decompose_anomalies(errSeries, 95, 24)
| mv-expand timestamp to typeof(datetime), errSeries to typeof(real), anomalies to typeof(double)
| where anomalies > 0 and errSeries > 0.02     // guardrail: >2% error rate
| project timestamp, service=cloud_RoleName, errorRate = round(errSeries*100.0, 2), anomalyScore = anomalies
| order by anomalyScore desc
SLO burn-rate (fast/slow windows) — great for paging
// Example: 99.9% success SLO
let slo = 0.999;
let fast = 5m;
let slow = 1h;
let targetBurn = 14.4; // page when you're burning 14.4x error budget
let agg = (win:timespan) {
  requests
  | where timestamp > ago(win)
  | summarize total=count(), errors=countif(success == false) by cloud_RoleName
  | project cloud_RoleName, errRate = todouble(errors)/todouble(total)
};let fastW = agg(fast);
let slowW = agg(slow);fastW
| join kind=inner slowW on cloud_RoleName
| extend burnFast = (1.0 - slo) == 0 ? 0.0 : errRate_left / (1.0 - slo),
         burnSlow = (1.0 - slo) == 0 ? 0.0 : errRate_right / (1.0 - slo)
| extend burnRate = burnFast / burnSlow
| where burnRate > targetBurn and errRate_left > (1.0 - slo)
| project service=cloud_RoleName, burnRate=round(burnRate,2), errRateFast=round(errRate_left*100,3), errRateSlow=round(errRate_right*100,3)
If you truly rely on the
Perftable (Legacy/VM/Container Insights), mirror the same logic onInsightsMetricsor your custom metric name instead ofrequests.
C. Wrap as reusable KQL functions (cleaner alerts)
Put these in your workspace as functions so alert rules stay tidy:
// function detect_failed_signin_anomalies(sensitivity:int, exclude:dynamic)
.create-or-alter function with (folder = "detections") detect_failed_signin_anomalies(sensitivity:int=95, exclude:dynamic=dynamic(["svc_"])) {
  let lookback = 14d;
  let baseline = 7d;
  let binSize = 1h;
  SigninLogs
  | where TimeGenerated > ago(lookback) and ResultType != 0
  | extend UPN = tostring(UserPrincipalName)
  | where not(UPN has_any (exclude))
  | summarize failed=count() by UPN, bin(TimeGenerated, binSize)
  | make-series failedSeries = avg(failed) on TimeGenerated from ago(baseline) to now() step binSize by UPN
  | extend anomalies = series_decompose_anomalies(failedSeries, sensitivity, 24)
  | mv-expand TimeGenerated to typeof(datetime), failedSeries to typeof(double), anomalies to typeof(double)
  | where anomalies > 0
  | project TimeGenerated, UPN, failed=failedSeries, anomalyScore=anomalies
}
Then your alert query is simply:
detections.detect_failed_signin_anomalies(96, dynamic(["svc_","breakglass@"]))
7) Alerting — make it actionable, low-noise, and easy to route
Use these Azure Monitor features:
- Split-by dimensions: create one alert per UPN or per service (dimension =
UPN/cloud_RoleName). This prevents multi-subject spam and lets you auto-route to the right team/user. - Frequency & lookback: start at 15 min frequency, 60 min lookback; move to 5 min when stable.
- Number of violations: require ≥2 consecutive evaluations before firing to avoid single-bin blips.
- Action Rules: suppress during maintenance windows / known noisy periods (e.g., big deployments).
- Custom properties: add UPN/service, anomaly score, last IP/geo to the alert payload (great for Logic Apps).
- Two tiers: create Severity 2 (page) for SLO burn and Severity 3–4 (notify) for simple anomalies.
Alert payload fields to include (custom details):
entity:UPNorservicesignal:failed_signin_anomaly/latency_p95_anomaly/error_rate_spikescore: anomaly scorecontext: last 3 IPs / countries or top failing endpointsrunbook: link to the remediation doc
Action Group wiring:
- Webhook to Logic App (primary)
- Teams/Slack channel for the owning team (dimension-based)
- ITSM connector (ticket auto-creation)
Logic App first steps (recommended):
- De-dup/suppress if an active incident exists for the same
entity+signal. - Enrich (Graph for user; Azure Resource Graph / GitOps for service).
- Route:
- Low impact → notify + ticket only
- High impact → Approval then action (require MFA / block; rollback/scale-to-0; revert PR)
Small but mighty quality-of-life tweaks
- Charts for reviewers: add a pinned workbook or the
render timechartline to queries you triage manuall
| project timestamp=TimeGenerated, failed=failedSeries
| render timechart
- Noise guardrails: in anomaly queries, add minimal absolute thresholds (e.g.,
failedSeries >= 5) so tiny blips don’t alert. - Holiday/weekend sensitivity: if you see seasonal false positives, lower
sensitivityon weekends or exclude public holidays with a small lookup table. - Service account registry: maintain a central list and pull it via
externaldata()from blob/gh raw URL so analysts can update without editing queries.
- Open Azure Monitor → Logs → run a query.
- Click New alert rule → set Resource = Log Analytics workspace.
- Condition = your query with threshold on results > 0.
- Action group = email/SMS/ITSM + Logic App webhook.
- Severity/ Evaluation frequency = start conservative (e.g., every 15 min).
8) Safe automation with Logic Apps / Functions
- Logic App receives alert → enrich context (user risk, geo, last successes, service health) → decide path:
- Notify only (initial weeks) with ticket in ITSM.
- Guard‑railed action (with approval) using Microsoft Graph (e.g., require MFA, temporary sign‑in block) or Kubernetes RBAC changes.
- All changes must be auditable and scoped by least privilege (see below).
Extending to EKS/GKE
- Reuse the Supervisor; install Concierge in each cluster.
- Keep OpenTelemetry Collector per cluster; export to the same Azure workspace (tag with
cloud.provider). - Reuse the same KQL queries across clouds; pivot by
cloud_RoleName/k8s.cluster.name.
Risks & mitigations
- False positives : Start in notify mode; iterate sensitivity and windows.
- Automation blast radius: Require manual approval for high‑impact steps; progressive rollout.
- Supervisor exposure: Place behind WAF, restrict IP ranges, and enforce TLS and HSTS.
- Least privilege: Graph scopes are limited to the actions you automate; Azure RBAC for Function/Logic App follows the principle of least privilege.
Cost & licensing
- Main cost: Log ingestion & retention. Control via sampling and 30–90d retention.
- KQL ML: No separate ML infra cost.
- Entra P2 (optional): Gives native risk signals; your KQL detections are a compensating control if you don’t have P2.
- Pinniped: Lightweight; infra cost is negligible compared to logs.
Copy‑ready snippets (appendix)
FederationDomain (Supervisor ↔ Entra)
apiVersion: authentication.supervisor.pinniped.dev/v1alpha1
kind: FederationDomain
metadata:
  name: entra-domain
  namespace: pinniped-supervisor
spec:
  issuer: https://pinniped.<your-domain>
  identityProviders:
  - name: azuread
    type: OIDC
    oidc:
      clientID: "<CLIENT_ID>"
      clientSecret: { name: "pinniped-azure-secret" }
      issuer: "https://login.microsoftonline.com/<TENANT_ID>/v2.0"
Minimal OTel Collector (to Azure Monitor)
receivers:
  otlp:
    protocols:
      grpc: {}
      http: {}
processors:
  batch: {}
  resourcedetection:
    detectors: [env, k8snode, k8scluster, k8s]
exporters:
  azuremonitor:
    connection_string: "InstrumentationKey=<APP_INSIGHTS_KEY>;IngestionEndpoint=https://<region>.in.applicationinsights.azure.com/"
service:
  pipelines:
    traces:
      receivers: [otlp]
      processors: [batch, resourcedetection]
      exporters: [azuremonitor]
    metrics:
      receivers: [otlp]
      processors: [batch, resourcedetection]
      exporters: [azuremonitor]
    logs:
      receivers: [otlp]
      processors: [batch, resourcedetection]
      exporters: [azuremonitor]
KQL — identity anomaly
SigninLogs
| where TimeGenerated > ago(14d)
| where ResultType != 0
| summarize failed=count() by bin(TimeGenerated, 1h), UserPrincipalName
| make-series failedSeries=avg(failed) on TimeGenerated from ago(7d) to now() step 1h by UserPrincipalName
| extend anomalies = series_decompose_anomalies(failedSeries, 95, 7)
| where array_length(anomalies) > 0
KQL — service latency anomaly
Perf
| where TimeGenerated > ago(7d) and CounterName == "request_duration_ms"
| summarize p95 = percentile(CounterValue, 95) by bin(TimeGenerated, 5m), ServiceName
| make-series p95Series=avg(p95) on TimeGenerated from ago(7d) to now() step 5m by ServiceName
| extend anomalies = series_decompose_anomalies(p95Series, 95, 7)
| where array_length(anomalies) > 0
What you get out of the box
- Copy‑pasteable Helm and YAML to stand up Supervisor/Concierge + OTel Collector
- Two production‑ready KQL anomaly queries
- Clear Azure Monitor alert and Logic App wiring steps
Optional: Policy & automation (why, when, how)
Why add this
- Guardrails, not gates: Prevent risky configs before they run (admission), and catch runtime drift (policy events to logs).
- Close the loop: Alerts that only page humans extend MTTR. A thin automation layer lets you enrich → decide → (optionally) act safely.
- Auditable control: Every automated action goes through Azure Monitor + Logic Apps with approvals and logs.
Real-life use cases
Suspicious sign-in spike (identity)
- Signal: KQL on
SigninLogsflags an outlier for a user/app. - Automation: Alert → Logic App enriches with user risk/geo → opens a ticket and (with approval) calls Microsoft Graph to require step-up MFA or a temporary sign-in block.
Privileged pod drift (runtime)
- Signal: Kyverno/Gatekeeper reports a pod with
privileged: trueorCAP_SYS_ADMIN. - Automation: Alert → Logic App posts to Slack/Teams, adds a JIRA incident, and (with approval) scales deployment to 0 in the affected namespace.
Unsigned image / wrong registry (supply chain)
- Signal: Admission policy denies images not coming from
my-acr.azurecr.ioor lacking a cosignature. - Automation: Create a short-lived exemption (24h) only if an approver signs off; log exemption to LA.
Namespace without owner/labels (ops hygiene)
- Signal: Admission denies namespace creation, missing
owner/costCenter. - Automation: Logic App pings the requester with a pre-filled
kubectl labelcommand.
Secrets in env vars (misconfig)
- Signal: Policy audits manifest referencing secrets as plaintext.
- Automation: Convert to
Secret+ volume mount via PR bot (GitOps flow) and open a security ticket.
What to deploy (minimal)
- Admission (prevent/mutate): Kyverno or OPA Gatekeeper.
- Runtime audit → logs: Emit policy results to Log Analytics.
- Decisioning: Azure Monitor alert rules (from KQL or policy events).
- Orchestration: Logic Apps (or Azure Functions) with human approval where impact is high.
Starter policies (Kyverno)
Deny privileged containers:
apiVersion: kyverno.io/v1
kind: ClusterPolicy
metadata:
  name: disallow-privileged
spec:
  validationFailureAction: enforce
  rules:
  - name: no-priv
    match: { resources: { kinds: ["Pod"] } }
    validate:
      message: "Privileged containers are not allowed."
      pattern:
        spec:
          containers:
          - securityContext:
              privileged: "false"
Require owner/cost center labels:
apiVersion: kyverno.io/v1
kind: ClusterPolicy
metadata:
  name: require-owner-labels
spec:
  validationFailureAction: enforce
  rules:
  - name: require-labels
    match: { resources: { kinds: ["Namespace","Deployment","StatefulSet"] } }
    validate:
      message: "owner and costCenter labels are required."
      pattern:
        metadata:
          labels:
            owner: "?*"
            costCenter: "?*"
Restrict images to your ACR:
apiVersion: kyverno.io/v1
kind: ClusterPolicy
metadata:
  name: restrict-registries
spec:
  validationFailureAction: enforce
  rules:
  - name: only-acr
    match: { resources: { kinds: ["Pod"] } }
    validate:
      message: "Images must come from my-acr.azurecr.io"
      pattern:
        spec:
          containers:
          - image: "my-acr.azurecr.io/*"
Prefer audit mode first: set
validationFailureAction: auditfor a week, tune, then flip toenforce
Identity anomaly flow
- KQL query on
SigninLogs(from the post) → Alert rule (every 15 min). - Action Group: Logic App webhook + Teams/JIRA.
- Logic App steps:
- Get user details + sign-in history (Graph).
- Check the recent successful MFA.
- Branch:
- Low impact: notify + ticket.
- High impact: Approval (Service Owner) → Graph
conditionalAccessupdate or temporary block. - Record the outcome back to Log Analytics.
Runtime/policy flow
- Kyverno → send policy events to Log Analytics table (via OTel or AKS diagnostics).
- KQL alert on new enforcement failures for
disallow-privileged. - Logic App:
- Pull Deployment/Pod metadata.
- Notify the service owner of the remediation snippet.
- Optional Approval →
az aks command invokeor GitOps PR to revert/patch.
When to skip (for now)
- Single cluster, small team, or no on-call automation culture yet.
- If you lack Entra/Graph privileges to enforce conditional access — start with observability + tickets, add enforcement later.
Need assistance? We’re happy to help.
If you are evaluating this for a proof of concept or planning deployments, DoiT can help. Our team of 100+ experts specializes in tailored cloud solutions, ready to guide you through the process and optimize your infrastructure for compliance and future demands.
Let’s discuss what makes the most sense for your company during this policy enforcement phase, ensuring your cloud infrastructure is robust, compliant, and optimized for success. Contact us today.