
Have you ever wondered what truly drives outcomes in complex systems? While traditional analytics might tell us what factors appear together, they rarely tell us whether one actually causes another. This distinction is crucial for making effective improvements in any domain.
Today, I’m sharing a project that demonstrates how combining causal analysis with generative AI can unlock powerful insights. I’ve applied this approach to customer satisfaction in support interactions, but the same techniques can transform virtually any field where understanding true cause-and-effect relationships matters.
Friendly link: https://medium.com/@edu7mota/d6bb91a19b6f?source=friends_link&sk=a6099b13d912952eb3714d222a4c062f
What is Causal Analysis?
Let’s take a moment to understand what makes causal analysis so powerful. In the world of data, we’re often drowning in correlations — things that happen together. For instance, ice cream sales and drowning incidents both increase in the summer. But does ice cream cause drowning? Of course not! They share a common cause: warm weather.
Causal analysis goes beyond simply identifying patterns to answer the fundamental question: “What happens if we intervene?” It’s the difference between:
- Correlation: “When A happens, B also tends to happen”.
- Causation: “If we make A happen, it will cause B to happen.”
Traditional machine learning excels at finding patterns and making predictions, but it struggles with the “what if” questions that drive decision-making. Causal analysis fills this gap by providing a framework to understand the actual effects of actions or interventions.
What is Causal NLP?
Causal NLP (Natural Language Processing) sits at the exciting intersection of causality and language processing. It enables us to:
- Extract causal relationships from text: Identifying when one event or factor causes another in natural language.
- Apply causal reasoning to language data: Using advanced techniques to determine which factors in text actually influence outcomes.
- Transform unstructured text into causal insights: Converting messy, real-world language into structured causal models.
In this project, I’ve leveraged causalnlp, a specialized library that combines causal inference techniques with natural language processing. It allows us to move beyond simply analyzing what words appear in a satisfied customer's feedback to understanding what aspects of the interaction caused their satisfaction.
The Power of Causality + GenAI
The combination of causal analysis and generative AI is particularly powerful because:
- GenAI can structure unstructured data — Converting qualitative information (like conversations) into structured data suitable for causal analysis
- Causal analysis separates correlation from causation — Moving beyond “these things appear together” to “this causes that”
- GenAI makes insights accessible — Translating complex statistical findings into natural language explanations
While I’ll demonstrate this with customer satisfaction data, imagine applying the same approach to healthcare outcomes, educational performance, supply chain optimization, or financial risk management. The possibilities are endless.
Understanding the Source Data
Before diving into the analysis, it’s important to understand the structure of the data that powers this causal inference system. The foundation is a dataset of customer support tickets with fields such as:
- Ticket Identifier (
ticket_id): A unique identifier for each support interaction - Conversation History (
comment_history_table_string): The complete textual log of conversations between customers and support agents - Platform and Product Information:
custom_platform: Details about the platform involved (e.g., 'amazon_web_services', 'google_cloud_platform')custom_product: Specifies the product or service the ticket pertains to- Support Case Usage (
cloud_support_case_used): Whether a formal support case was created - Customer Rating (
rating): The original rating provided by the customer (e.g., 'good', 'offered')
This structured dataset, particularly the textual conversation history, serves as the input for the generative AI analysis that powers the causal inference process.
A Simple Example: Customer Satisfaction
To demonstrate the power of this approach, I’ve built a system that analyzes what truly drives customer satisfaction in support interactions. This is just one straightforward application — the techniques are adaptable to many other domains. The data is synthetic data based on the structure of real data.
Github Repository: https://github.com/eduamota/genai-causal-inference
The Data Processing Pipeline
First, I extract structured information from raw support tickets using a series of Python scripts and Amazon Bedrock:
def analyze_resolution_with_nova(text, bedrock_client):
    """
    Use Amazon Bedrock's Nova Lite model to determine if the issue was resolved.
    """
    prompt = f"""Context: You are analyzing a support ticket conversation.
Based on the conversation history, determine if the customer's issue was resolved or not.
Only respond with the word 'resolved' or 'unresolved'.
Conversation history:
{text}
Was the issue resolved?"""

    messages = [\
        {"role": "user", "content": [{"text": prompt}]},\
    ]
    inf_params = {"maxTokens": 100, "topP": 0.1, "temperature": 0.1}
    try:
        response = bedrock_client.converse(
            modelId="us.amazon.nova-lite-v1:0",
            messages=messages,
            inferenceConfig=inf_params
        )
        result = response["output"]["message"]["content"][0]["text"].lower()

        # Return the analysis result
        if 'resolved' in result and 'unresolved' not in result:
            return 'resolved'
        else:
            return 'unresolved'

    except Exception as e:
        print(f"Error analyzing resolution: {e}")
        return None
My complete pipeline includes:
- Sentiment Analysis (
01_sentiment_analysis.py): Using Bedrock's Nova model to classify the emotional tone of conversations - Numeric Conversion (
02_convert_to_numeric.py): Transforming categorical data into numerical formats - Resolution Detection (
03_identify_resolution.py): Determining if issues were resolved, as shown in the code above - Understanding Evaluation (
04_evaluate_understanding.py): Assessing if agents properly understood customer problems - Graph Creation (
05_create_neptune_gremlin.py): Preparing the data for loading into Neptune Analytics
This approach is broadly applicable. In healthcare, you might extract diagnoses from clinical notes; in finance, risk factors from reports; in education, learning patterns from student interactions.
Causal Graph Modeling
Next, I represent the relationships as a graph in Neptune Analytics:
# Convert dataframe to Neptune-compatible graph format
def convert_to_neptune_gremlin_csv(df, output_dir):
    """
    Convert a dataframe to Neptune-compatible Gremlin CSV format
    """
    # Create vertices for different entity types
    rating_vertices = df.copy()
    rating_vertices['~id'] = 'rating_' + rating_vertices.index.astype(str)
    rating_vertices['~label'] = 'rating'

    resolution_vertices = df[['resolution_status', 'resolution_numeric']].drop_duplicates()
    resolution_vertices['~id'] = 'resolution_' + resolution_vertices['resolution_status']
    resolution_vertices['~label'] = 'resolution'

    # Create edges representing causal relationships
    resolution_rating_edges = df.copy()
    resolution_rating_edges['~id'] = 'edge_res_rating_' + resolution_rating_edges.index.astype(str)
    resolution_rating_edges['~from'] = 'resolution_' + resolution_rating_edges['resolution_status']
    resolution_rating_edges['~to'] = 'rating_' + resolution_rating_edges.index.astype(str)
    resolution_rating_edges['~label'] = 'AFFECTS'
    resolution_rating_edges['weight'] = resolution_rating_edges['resolution_effect']
This graph structure can represent causal relationships in any domain. In healthcare, you might model how treatments affect outcomes; in education, how teaching methods influence learning; in finance, how policy changes impact market behavior.
Neptune Analytics Schema
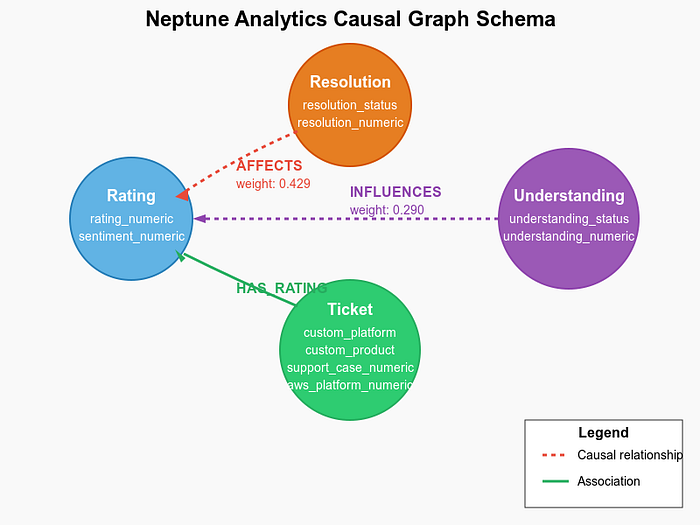
The graph schema in Neptune Analytics forms the backbone of our causal analysis system. Here’s the structure:
Neptune Schema
Graph Nodes (Vertices)
The graph contains several types of nodes:
- Rating nodes: Representing customer ratings with properties like rating_numeric
- Resolution nodes: Capturing whether issues were resolved (resolved/unresolved)
- Understanding nodes: Reflecting agent understanding (understood/misunderstood)
- Ticket nodes: Containing all original ticket properties and derived metrics
Graph Relationships (Edges)
The edges in our graph represent the causal relationships:
- AFFECTS relationship: Connects resolution status to ratings, with weights representing causal strength
- INFLUENCES relationship: Links understanding status to ratings
- HAS_RATING relationship: Associates tickets with their ratings
This graph structure allows for powerful causal queries and visualizations of the factors influencing customer satisfaction.
Calculating Causal Effects
Using a causal inference model, I calculate the actual treatment effects:
from causalnlp import CausalInferenceModel
from lightgbm import LGBMClassifier

# Create a causal inference model
cm = CausalInferenceModel(df,
                         metalearner_type='t-learner',
                         learner=LGBMClassifier(num_leaves=10),
                         treatment_col='resolution_numeric',
                         outcome_col='rating_numeric',
                         text_col='comment_history_table_string',
                         include_cols=['aws_platform_numeric', 'custom_product',\
                                      'sentiment', 'support_case_numeric',\
                                      'understanding_numeric'])
# Fit and estimate causal effects
cm.fit()
ate = cm.estimate_ate()
print(f"Average Treatment Effect: {ate['ate']}")
# Output: Average Treatment Effect: 0.4294348212219044
This calculation reveals that resolving a customer’s issue causes a 42.9 percentage point increase in positive ratings. This is a causal relationship, not just a correlation — a critical distinction for making effective improvements.
Natural Language Interface with Bedrock
Finally, I built a Bedrock agent that connects to Neptune Analytics, allowing users to ask questions in natural language:
neptune_endpoint = os.environ.get('NEPTUNE_ANALYTICS_ENDPOINT')
region = os.environ.get('AWS_REGION', 'us-east-1')
neptune_client = boto3.client('neptune-graph', region_name=region)

def execute_query(query, params=None):
    """Execute an openCypher query against Neptune Analytics"""
    try:
        if params:
            response = neptune_client.execute_query(
                graphIdentifier=neptune_endpoint,
                queryString=query,
                language='OPEN_CYPHER',
                parameters=params
            )
        else:
            response = neptune_client.execute_query(
                graphIdentifier=neptune_endpoint,
                queryString=query,
                language='OPEN_CYPHER'
            )

        # Parse the response
        payload = json.loads(response['payload'].read().decode('utf-8'))
        return payload
    except Exception as e:
        logger.error(f"Error executing query: {e}")
        return {"error": str(e)}

def lambda_handler(event, context):
    try:

        action = event['actionGroup']
        api_path = event['apiPath']
        logger.info(f"Processing action: {action}, API path: {api_path}")

        if api_path == '/getRatingStatistics':
            body = get_rating_statistics()
        elif api_path == '/getResolutionImpact':
            body = get_resolution_impact()
        elif api_path == '/getUnderstandingImpact':
            body = get_understanding_impact()
        elif api_path == '/getCombinedFactors':
            body = get_combined_factors()
        elif api_path == '/getPlatformComparison':
            body = get_platform_comparison()
        elif api_path == '/getAnomalies':
            parameters = event.get('parameters', [])
            body = get_anomalies(parameters)
        elif api_path == '/runCustomQuery':
            parameters = event.get('parameters', [])
            body = run_custom_query(parameters)
        else:
            logger.warning(f"Invalid API path: {api_path}")
            body = {"{}::{} is not a valid api, try another one.".format(action, api_path)}

        response_body = {
            'application/json': {
                'body': str(body)
            }
        }

        action_response = {
            'actionGroup': event['actionGroup'],
            'apiPath': event['apiPath'],
            'httpMethod': event['httpMethod'],
            'httpStatusCode': 200,
            'responseBody': response_body
        }

        response = {'response': action_response}
        logger.info("Lambda execution completed successfully")
        return response
This interface makes complex causal insights accessible to non-technical users. A doctor could ask “What treatment most effectively reduces readmission rates?” or an educator might inquire “Which teaching method has the strongest effect on test scores?”
Data Flow and System Architecture
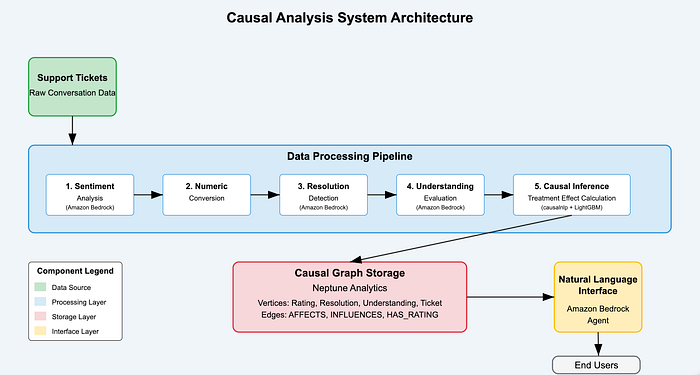
Solution Architecture Diaagram
![System Architecture Diagram — Insert diagram showing the complete system architecture with data flow between components]
The diagram above illustrates the end-to-end flow of data through our causal analysis system:
- Raw ticket data enters the pipeline
- Generative AI extracts features from unstructured text
- Causal inference calculates effect strengths
- Neptune Analytics stores the graph structure
- Bedrock agent provides natural language access to insights
This architecture connects all components into a seamless pipeline from raw data to actionable insights.
The Architecture: End-to-End Integration
The complete architecture of this causal analysis system connects several powerful components:
- Data Processing with Generative AI: Amazon Bedrock’s Nova Lite model transforms unstructured conversation text into structured features that feed the causal model
- Causal Inference Processing: Libraries like
causalnlpwith a learner such as LightGBM analyze the relationships between features and outcomes to quantify causal impacts - Graph-Based Storage: Neptune Analytics stores the complex, interconnected data including tickets, features, and calculated causal relationships, enabling efficient exploration
- Natural Language Interface: A Bedrock agent queries the Neptune Analytics graph using openCypher and provides data-driven insights to users in natural language
This architecture forms a complete pipeline from raw data to actionable insights, with generative AI playing a critical role in transforming complex conversational data into structured, analyzable information.
The Results: Detailed Causal Insights
In our customer satisfaction example, the system revealed precise quantitative insights:
- Resolution is the primary driver — Resolving customer issues causes a 42.9 percentage point increase in positive ratings.
- Resolved issues receive an average rating of 83% positive.
- Unresolved issues receive an average rating of 41% positive.
- Understanding amplifies the effect — Agent understanding provides a significant boost.
- When agents understand: 67% positive ratings.
- When agents misunderstand: 38% positive ratings.
- Combined effects show the optimal path:
- Understood + Resolved: 91% positive ratings.
- Understood + Unresolved: 52% positive ratings.
- Misunderstood + Resolved: 61% positive ratings.
- Misunderstood + Unresolved: 29% positive ratings.
These detailed breakdowns provide clear direction: prioritizing issue resolution while ensuring agents demonstrate understanding creates the optimal conditions for customer satisfaction.
But these customer satisfaction insights are just one example. The same approach could reveal:
- In healthcare: Which intervention most effectively reduces hospital readmissions.
- In education: What teaching method has the strongest causal effect on student outcomes.
- In e-commerce: Which product recommendations actually cause increased purchases.
- In manufacturing: What process changes truly improve quality metrics.
- In HR: Which workplace policies causally impact employee retention.
The Technical Implementation
This approach requires just a few core components:
- Data extraction with generative AI — Use models like Claude or GPT to structure unstructured data.
- Causal inference modeling — Apply statistical techniques to identify causal relationships.
- Graph database for relationships — Store and query the causal model in a graph database.
- Natural language interface — Make insights accessible through conversational AI.
# Infrastructure as code with AWS CDK
class NeptuneAnalyticsStack(Stack):
    def __init__(self, scope: Construct, construct_id: str, **kwargs) -> None:
        super().__init__(scope, construct_id, **kwargs)

    # Create a Neptune Analytics Graph
        graph = neptunegraph.CfnGraph(
            self, "NeptuneAnalyticsGraph",
            graph_name="causal-analysis-graph",
            provisioned_memory=16,
            replica_count=0,
            vector_search_configuration=neptunegraph.CfnGraph.VectorSearchConfigurationProperty(
                vector_search_dimension=1024
            ),
            public_connectivity=True,
        )

        # Create Bedrock agent for Neptune Analytics
        bedrock_agent = BedrockAgentConstruct(
            self, "BedrockAgent",
            neptune_analytics_endpoint=graph.attr_graph_id
        )
OpenCypher Query Examples
The power of Neptune Analytics lies in its ability to query complex causal relationships using OpenCypher. Here are some example queries that demonstrate the capabilities:
// Calculate average rating by resolution status
MATCH (res:resolution)-[r:AFFECTS]->(rating:rating)
RETURN res.resolution_status,
       avg(rating.rating_numeric) AS avg_rating,
       count(*) AS count
{
  "results": [\
    {\
      "res.resolution_status": "resolved",\
      "avg_rating": 0.4444444444444446,\
      "count": 72\
    },\
    {\
      "res.resolution_status": "unresolved",\
      "avg_rating": 0.1875,\
      "count": 128\
    }\
  ]
}
// Find the combined effect of resolution and understanding
MATCH (res:resolution)-[:AFFECTS]->(rating:rating),
      (u:understanding)-[:INFLUENCES]->(rating)
RETURN res.resolution_status,
       u.understanding_status,
       avg(rating.rating_numeric) AS avg_rating,
       count(*) AS count
ORDER BY avg_rating DESC
{
  "results": [\
    {\
      "res.resolution_status": "resolved",\
      "u.understanding_status": "misunderstood",\
      "avg_rating": 0.6000000000000001,\
      "count": 5\
    },\
    {\
      "res.resolution_status": "resolved",\
      "u.understanding_status": "understood",\
      "avg_rating": 0.43283582089552214,\
      "count": 67\
    },\
    {\
      "res.resolution_status": "unresolved",\
      "u.understanding_status": "misunderstood",\
      "avg_rating": 0.26666666666666666,\
      "count": 45\
    },\
    {\
      "res.resolution_status": "unresolved",\
      "u.understanding_status": "understood",\
      "avg_rating": 0.14457831325301204,\
      "count": 83\
    }\
  ]
}
These queries allow us to explore the causal relationships in the graph and extract actionable insights.
Business Applications: Beyond Technical Insights
The power of this approach lies not just in the technical implementation, but in how the insights can transform business practices:
- Agent Training and Coaching: By quantifying exactly how much resolution and understanding impact satisfaction, organizations can develop targeted training programs focused on the highest-impact skills.
- Process Improvement: Understanding the causal factors that drive outcomes enables organizations to redesign processes for optimal results rather than making changes based on correlation.
- Democratized Insights: By providing a natural language interface to causal insights, this approach puts data-driven decision making directly in the hands of frontline staff and managers.
- Anomaly Detection: The system can identify cases where factors like sentiment don’t align with ratings, highlighting opportunities for investigation and learning.
Why This Matters Across Industries
The combination of causal analysis and generative AI can transform decision-making in virtually any field:
- Move beyond correlation — Understand what actually causes your desired outcomes.
- Quantify impact — Know exactly how much each factor contributes.
- Prioritize interventions — Focus resources where they’ll have the greatest causal effect.
- Make insights accessible — Allow non-technical stakeholders to ask causal questions.
Conclusion: Just the Beginning
This customer satisfaction example demonstrates the potential of combining causal analysis with generative AI, but it barely scratches the surface of what’s possible. As these technologies become more accessible, organizations that harness causal understanding will gain significant advantages in decision-making.
I encourage you to think about where causal analysis could transform your own field. What relationships have you observed but aren’t sure if they’re causal? What outcomes are you trying to improve but aren’t certain which levers to pull? These are exactly the questions this approach can help answer.
What domain would you apply causal analysis to? What outcomes would you want to understand causally? I’d love to hear your ideas in the comments!
To know more about DoiT and what we can help you achieve, visit doit.com/services
Github Repository: https://github.com/eduamota/genai-causal-inference