Announcement
Understand Spend Changes with Time Period Comparisons
By Josh Bonner
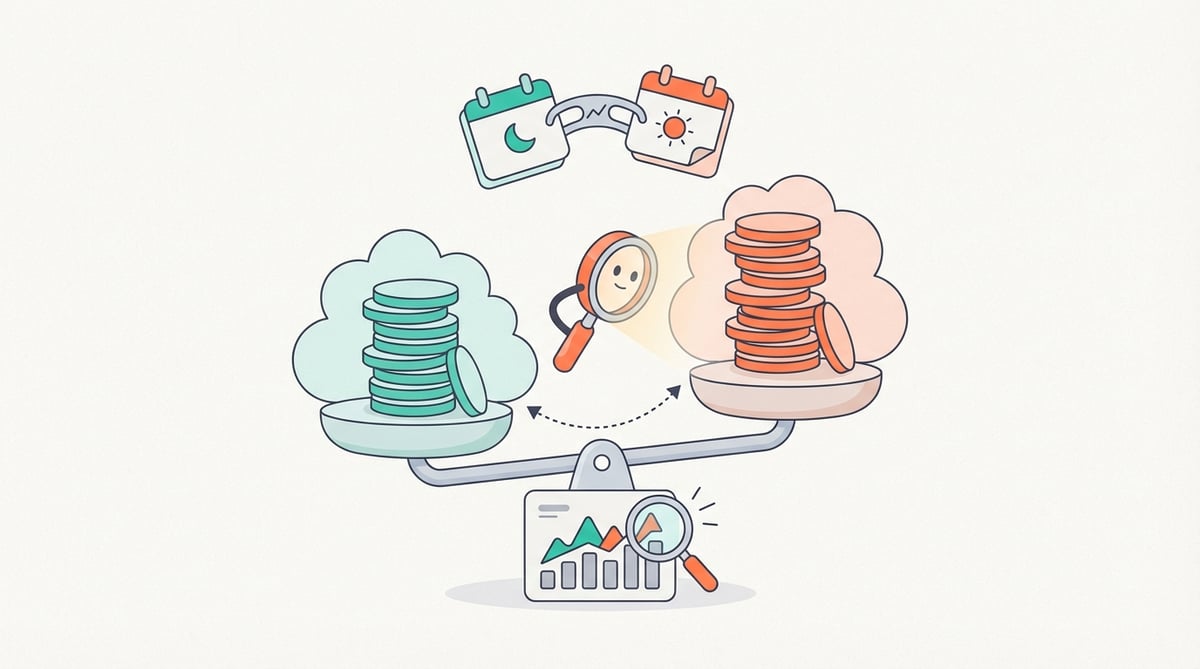
Compare spend across two time periods in a single report to spot trends, measure optimization impact, and identify unexpected cost increases faster.
Understanding cloud spend isn’t just about what you’re spending today, it’s about how that spend is changing over time.
Instead of running multiple reports with different time windows, you can now:
- Compare spend and usage across two time periods in one view
- Identify trends and seasonality at a glance
- Quickly measure the impact of optimizations or configuration changes
- Spot unexpected increases earlier
With time period comparisons, you can define a primary and secondary time window in the same report. Instantly see total values, absolute change, and percent change, with visual highlights that draw attention to the largest increases and decreases. This makes it easier to understand what changed, how much it changed, and where to focus next.
To get started, open a new or existing report and add a secondary time window.
For more details about time period comparisons, check out our Help documentation.