

Trusted by teams where observability spend is mission-critical
Connect in minutes
One API key. Full Coralogix visibility.
Connect Coralogix with a read-only API key scoped to usage and billing endpoints. DoiT ingests ingestion volume, priority mix, and retention data automatically — no agents, no pipeline rewrites, no forwarding of log data. You're looking at unified reports within hours of connecting.
What you get
Built for the realities of running Coralogix at scale
The things FinOps and observability leaders actually ask us for when they connect their Coralogix account.
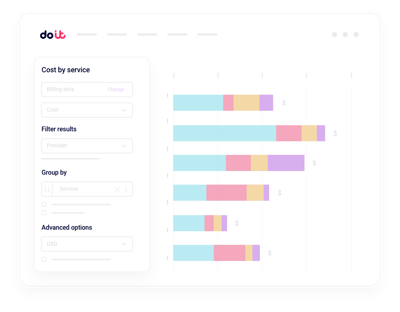
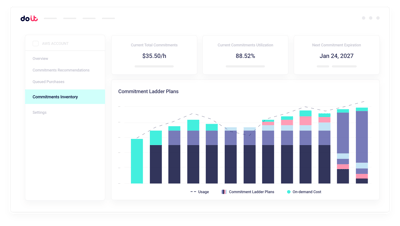
Unified ingestion reporting
Slice Coralogix usage by team, subsystem, application, or priority class without building custom pipelines.
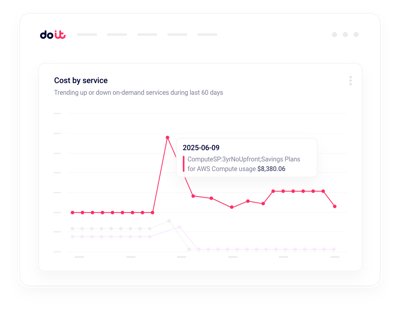
Real-time anomalies
Get alerted on ingestion spikes in minutes, not hours.
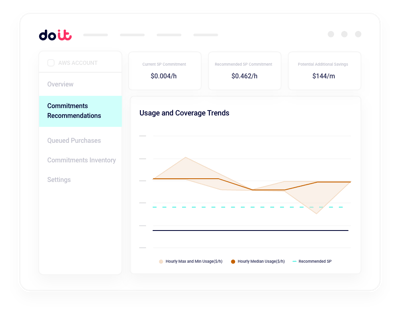
TCO optimization insights
Spot noisy log sources and candidates for the Frequent Search, Monitoring, or Compliance tiers.
Quota and plan tracking
Track daily quota burn against your Coralogix plan before overages hit.
High-cardinality visibility
Find the labels, fields, and services driving runaway log and metric volume inside busy subsystems.
Governance and budgets
Set ingestion budgets per team without chasing subsystem tag hygiene.
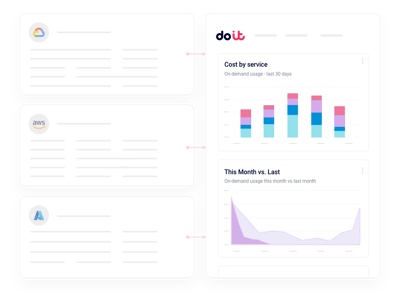
The native usage view tells you what you ingested. Cloud Intelligence™ helps you do something about it.
Beyond the Coralogix usage page
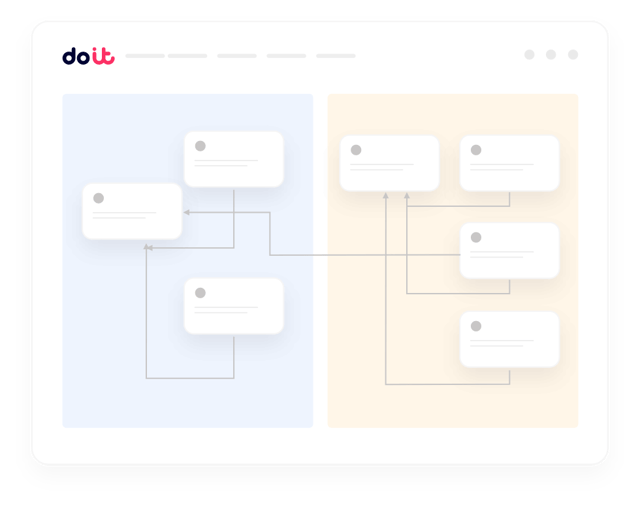
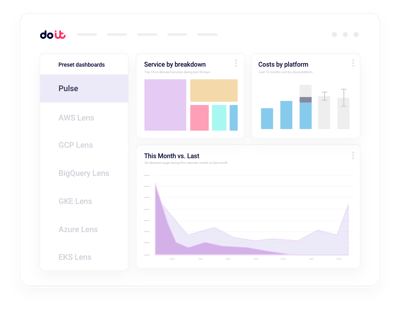
Team and subsystem rollups
Consolidated views across your entire Coralogix account, with drilldown into any team, application, or subsystem.
Real-time anomaly alerts
Machine-learning detection across ingestion volume, priority class, and subsystem, routed to Slack or email.
Retention and priority modeling
Model the cost impact of moving log streams between Frequent Search, Monitoring, and Compliance tiers before you commit.
Label and allocation hygiene
Find untagged ingestion, enforce allocation rules, and split shared observability costs the way finance expects.
Kubernetes log attribution
Break down Coralogix ingestion by cluster, namespace, and workload without extra exporters.
Forward Deployed Engineers
World-class cloud architects who work as an extension of your team to implement optimizations.
Fast-growing companies run on DoiT Cloud Intelligence™
Avg. savings within first 90 days
Avg implementation time
“DoiT's focus on reliability, mixed with the system's flexibility, helps us safely optimize our Amazon EKS workloads with zero-touch from our engineers.”
Oren Ashkenazy
Director of DevOps and Cloud at Fiverr
Ready to connect your Coralogix account?
Put ingestion and retention spend in a new light.
Frequently asked
questions
How do I get better visibility into Coralogix costs across teams?
Connect your Coralogix account once. Cloud Intelligence™ pulls usage data for every team and subsystem, so you can slice ingestion and retention spend by application, priority class, or owner from a single view — no spreadsheets, no manual rollups.
What's the best way to integrate Coralogix usage data with Cloud Intelligence™?
Create a read-only API key with access to Coralogix usage and billing endpoints. DoiT handles ingestion, normalization, and granular reporting. Most teams are live within a day.
How can I see which applications or subsystems drive most of my observability spend?
Usage reports let you drill from total ingestion down to a specific subsystem, application, or log source. You can filter by team, priority class, or retention tier without writing queries.
How can I monitor Coralogix ingestion anomalies in real-time?
Anomaly detection runs continuously across subsystems, priority classes, and teams. When ingestion spikes, you get a Slack or email alert with the likely source — long before you burn through your daily quota.
How can I optimize Coralogix retention and priority tiers?
Cloud Intelligence™ highlights log streams that are over-indexed for their actual query pattern, so you can shift noisy sources from Frequent Search into Monitoring or Compliance, or convert them into metrics, without losing coverage.
How can I get visibility into high-cardinality logs and metrics?
Cardinality is the silent driver of observability cost. Cloud Intelligence™ breaks down ingestion by label, field, and service so you can identify the few dimensions generating the majority of volume.
How is Cloud Intelligence™ different from the native Coralogix usage page?
The Coralogix usage page shows what you ingested. Cloud Intelligence™ is a platform: multi-tool observability visibility, proactive recommendations, real-time anomaly detection, governance, retention modeling, and access to forward deployed engineers who help you act on what the data shows.
Is my data secure when I connect my Coralogix account?
Cloud Intelligence™ uses a read-only API key with least-privilege scopes. We only read usage and billing metadata, never log content, and the platform is SOC 2 Type II certified.