

Trusted by teams running Kubernetes at scale
Connect in minutes
One lightweight agent. Every namespace covered.
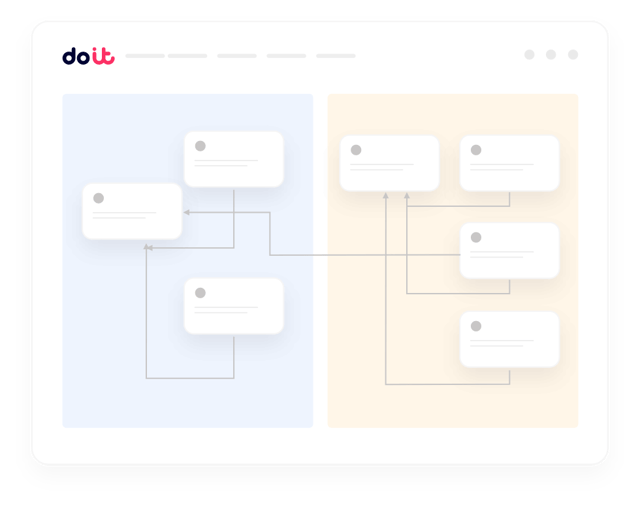
Deploy the DoiT collector to your EKS, GKE, or AKS clusters with a single Helm chart. We stitch pod-level usage together with your cloud billing data, so namespace, label, and workload costs show up alongside the rest of your cloud spend — no custom exporters, no forwarded metrics.
What you get
Built for the realities of running Kubernetes
The things FinOps and platform teams actually ask us for when they connect their clusters.
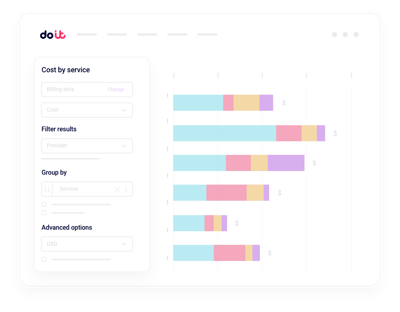
Namespace and workload allocation
Attribute cluster cost to the namespace, deployment, or label that actually generated it — no SQL, no rebuilds.
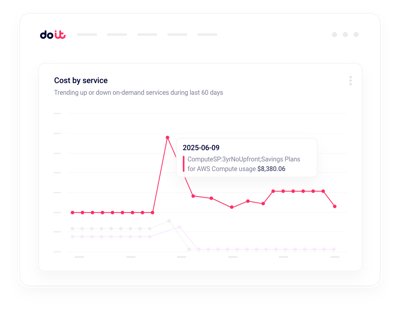
Cluster anomalies
Get alerted when a namespace or workload starts burning unexpected resources.
Container right-sizing
CPU and memory recommendations per workload, based on real request vs usage patterns.
Idle pod detection
Surface deployments and jobs that are provisioned but doing nothing useful.
Node and autoscaler insight
Understand node pool efficiency, bin-packing waste, and where Spot or autoscaling could cut your bill without hurting reliability.
Team chargeback and budgets
Split shared cluster cost across teams and set budgets per namespace without chasing label hygiene.
Native tools tell you what a pod is using. Cloud Intelligence™ helps you turn that into cost action.
Beyond kubectl top and cloud bills
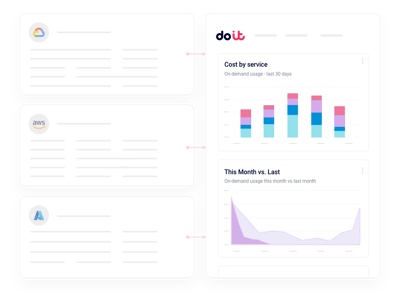
Multi-cluster rollups
Consolidated views across every EKS, GKE, and AKS cluster, with drilldown into any namespace or workload.
Real-time workload anomalies
Machine-learning detection on namespace, workload, and label dimensions, routed to Slack or email.
Right-sizing and capacity planning
Model CPU, memory, and replica changes against actual traffic before you roll them into production.
Label and allocation hygiene
Find unlabeled spend, enforce allocation rules, and split shared services the way finance expects.
Cloud-native cost mapping
Tie pod usage back to the underlying EC2, GCE, or Azure VM cost so every container carries a real dollar figure.
Forward Deployed Engineers
World-class cloud architects who work as an extension of your team to implement optimizations.
Fast-growing companies run on DoiT Cloud Intelligence™
Avg. savings within first 90 days
Avg implementation time
“DoiT's focus on reliability, mixed with the system's flexibility, helps us safely optimize our Amazon EKS workloads with zero-touch from our engineers.”
Oren Ashkenazy
Director of DevOps and Cloud at Fiverr
Ready to right-size your clusters?
Turn pod-level usage into workload-level savings.
Frequently asked
questions
How do I allocate Kubernetes costs across namespaces and teams?
Cloud Intelligence™ joins pod-level usage with your cloud bill, so you can see exact cost per namespace, deployment, label, or team. Shared cluster costs (control plane, system pods, idle capacity) are split using rules your finance team can actually defend.
How do I connect my Kubernetes clusters to Cloud Intelligence™?
Install our Helm chart in each cluster. The collector streams pod, node, and PV usage to DoiT, where it's joined to your existing cloud billing integration. Most teams see their first namespace-level report the same day.
Can I right-size pods without breaking workloads?
Yes. Recommendations are based on real CPU and memory usage patterns over time, not a single snapshot. You can review suggestions per workload, stage them in non-production first, and only roll forward what's safe.
How do I catch Kubernetes cost anomalies before the bill arrives?
Anomaly detection runs continuously on namespace, workload, and label dimensions. When a deployment suddenly doubles its node consumption or a runaway job starts scaling, you get a Slack or email alert with the likely cause.
How is this different from kubectl top, Prometheus, or the built-in cloud cost tools?
Those tools show usage or raw bills, not cost per workload. Cloud Intelligence™ combines usage with pricing, commitments, and shared-cost rules to give you dollar-accurate allocation, right-sizing, and governance in one place.
Does it work across EKS, GKE, and AKS?
Yes. The same collector and reports work across managed Kubernetes on AWS, Google Cloud, and Azure, as well as self-managed clusters. You get a unified view even when workloads span multiple clouds.
Can I use Spot, autoscaling, and commitments more aggressively?
Cloud Intelligence™ shows where workloads are safe for Spot, where node pools are over-provisioned, and how Savings Plans, CUDs, or Reservations apply to your Kubernetes nodes — so you can commit and autoscale with confidence.
Is my cluster data secure?
The collector uses least-privilege RBAC and only reads metadata and usage metrics — never your application data. The platform is SOC 2 Type II certified and we never make changes to your clusters without your approval.