

Trusted by teams that take observability spend seriously
Connect in minutes
One API key. Full New Relic visibility.
Connect your New Relic account with a read-only API key. DoiT pulls usage, ingest volume, retention tier, and billable user data automatically — no agents, no code changes, no extra exporters. You're looking at unified observability spend reporting within hours of connecting.
What you get
Built for teams scaling on New Relic
The visibility FinOps and platform leaders ask us for when their observability bill starts to rival their cloud bill.
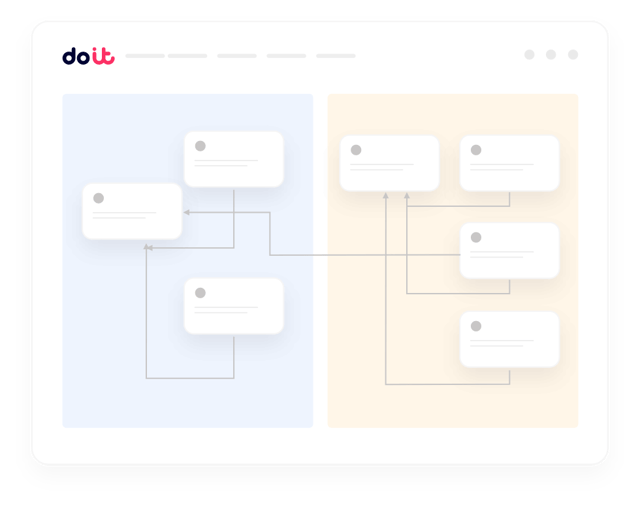
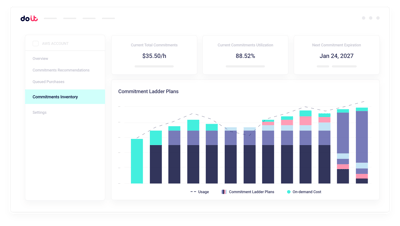
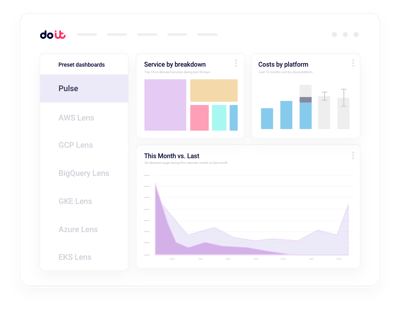
Unified observability cost reporting
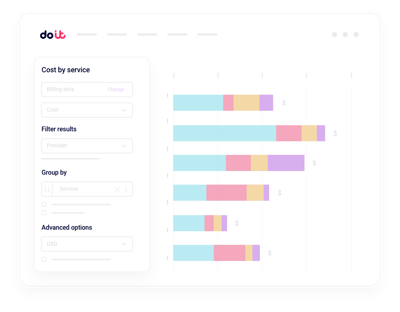
Slice New Relic spend by account, host, service, or team alongside your cloud costs in a single view.
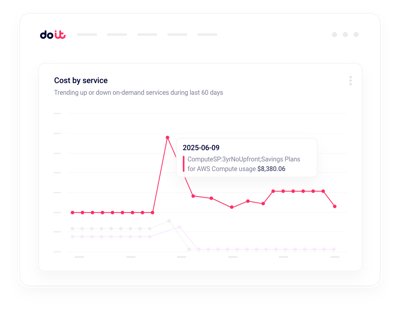
Real-time ingest anomalies
Get alerted on data volume spikes in minutes, before they hit the invoice.
High-cardinality hotspots
Surface the metrics, logs, and labels driving disproportionate ingest cost.
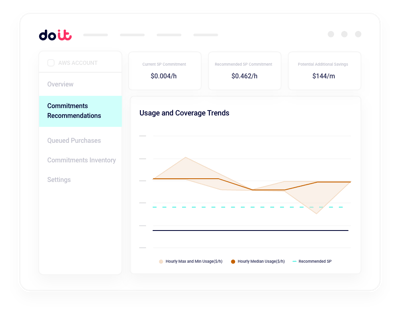
Retention tier optimization
See what you're paying to keep and tune retention before storage compounds.
Telemetry source attribution
Untangle which apps, hosts, and pipelines are responsible for ingest growth that hides behind 'Other'.
User and budget governance
Track full and core user counts, and set budgets per team without spreadsheet wrangling.
New Relic shows you what you ingested. Cloud Intelligence™ helps you decide what to do about it.
Beyond the New Relic usage UI
Multi-account rollups
Consolidated views across every New Relic sub-account, with drilldown into any host, service, or workload.
Real-time ingest alerts
Machine-learning detection on data volume by source, host, and service, routed to Slack or email.
Retention and tier planning
Model Data Plus and retention changes against actual ingest patterns before you commit to a tier.
Tag and allocation hygiene
Find unattributed telemetry, enforce labelling rules, and split shared observability cost the way finance expects.
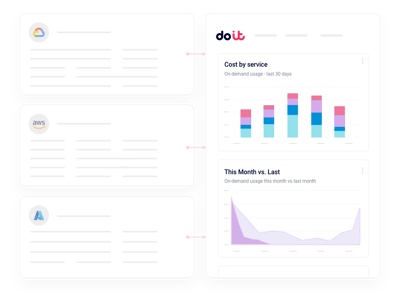
Observability-to-cloud allocation
Map New Relic spend back to the same teams, services, and namespaces driving your cloud bill.
Forward Deployed Engineers
World-class cloud architects who work as an extension of your team to implement optimizations.
Fast-growing companies run on DoiT Cloud Intelligence™
Avg. savings within first 90 days
Avg implementation time
“DoiT's focus on reliability, mixed with the system's flexibility, helps us safely optimize our Amazon EKS workloads with zero-touch from our engineers.”
Oren Ashkenazy
Director of DevOps and Cloud at Fiverr
Ready to connect your New Relic account?
Put your observability spend on the same map as your cloud.
Frequently asked
questions
How do I get visibility into New Relic costs across multiple sub-accounts?
Connect your New Relic account once. Cloud Intelligence™ pulls usage and billing data for every sub-account, so you can slice ingest, retention, and user costs by account, service, or team from a single view — no NRQL required.
What's the best way to integrate New Relic billing data with Cloud Intelligence™?
Use a read-only API key. DoiT handles ingestion, normalization, and reporting against your usage and billing endpoints. Most teams are live within a day and can see observability spend next to cloud spend immediately.
How can I see which apps or services are driving most of my New Relic ingest?
Drill from top-level ingest down to a specific app, host, or pipeline. Filter by entity, environment, or label to find the high-cardinality metrics, verbose logs, or chatty services responsible for cost growth.
How can I monitor New Relic ingest anomalies in real-time?
Anomaly detection runs continuously across data sources, hosts, and services. When ingest deviates from baseline, you get a Slack or email alert with the likely cause — long before it shows up on the invoice.
How can I optimize retention and Data Plus tier choices?
Cloud Intelligence™ models the impact of retention and tier changes against your actual ingest patterns, so you can decide where extended retention is worth it and where it isn't, instead of guessing.
How can I track full and core user counts across teams?
User-based costs are tracked alongside ingest, so you can see how seat counts evolve, attribute them to teams, and set budgets without manually exporting from the New Relic usage UI.
How is Cloud Intelligence™ different from New Relic's built-in usage view?
The native usage UI shows New Relic-only consumption. Cloud Intelligence™ unifies it with your cloud spend: cross-platform allocation, anomaly detection, retention modeling, governance, and access to forward deployed engineers who help you act on what the data shows.
Is my data secure when I connect my New Relic account?
Cloud Intelligence™ uses a read-only API key with least-privilege scope. We never modify configuration or telemetry without your approval, and the platform is SOC 2 Type II certified.