
Get a live map of your cloud infrastructure. Resolve incidents faster and make better architecture decisions with DoiT Cloud Diagrams.

Overview
Infrastructure maps that stay current so you don't have to
Cloud Diagrams scans your live cloud environment and generates architecture views with cost data, security context, and dependency relationships built in.
Always-current visualization
Automatically reflects infrastructure changes as they happen in your AWS accounts and Google Cloud projects. No manual updates needed.
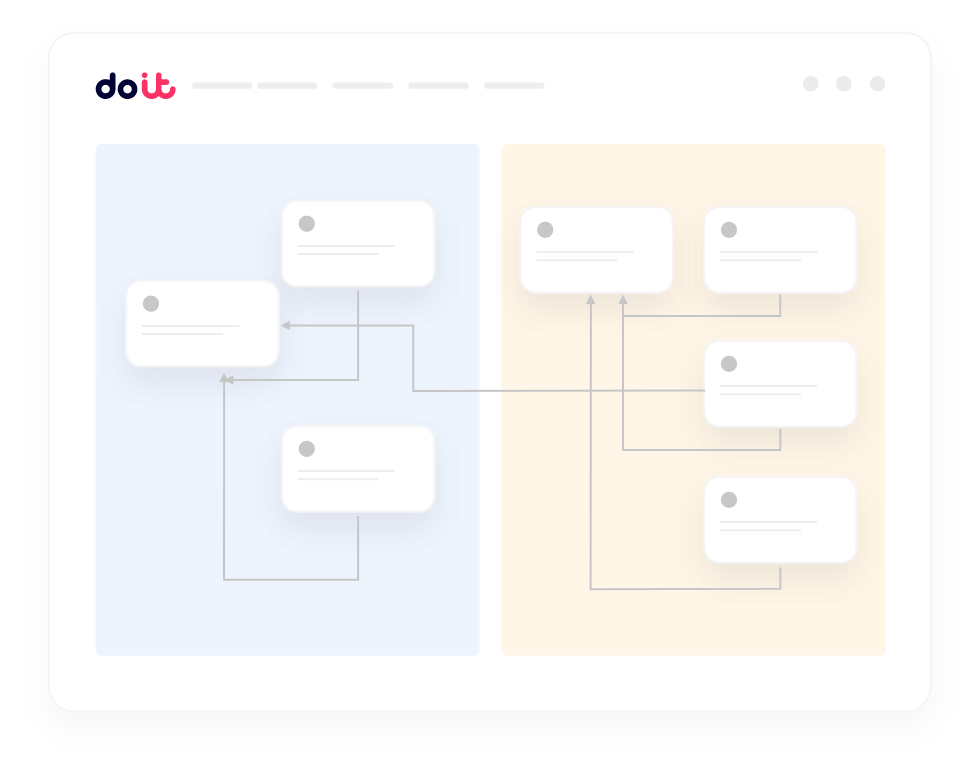
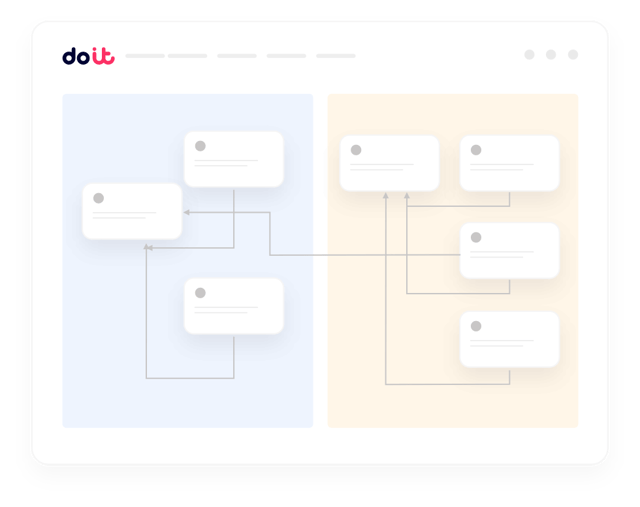
Cross-account network views
Visualizes network traffic and connectivity across multiple accounts, projects, VPCs, and regions in a single view.
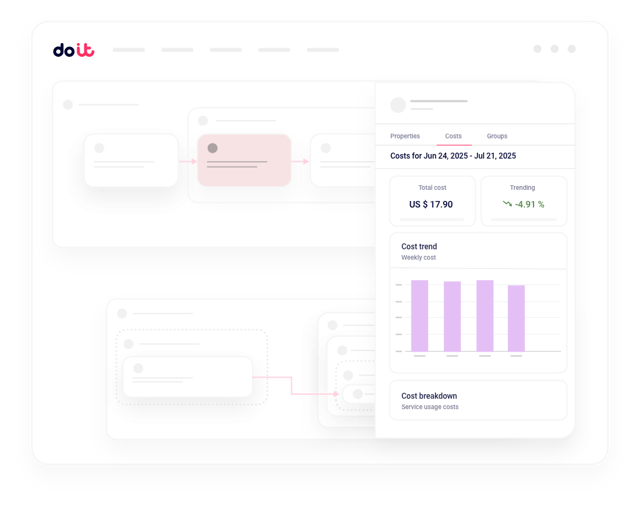
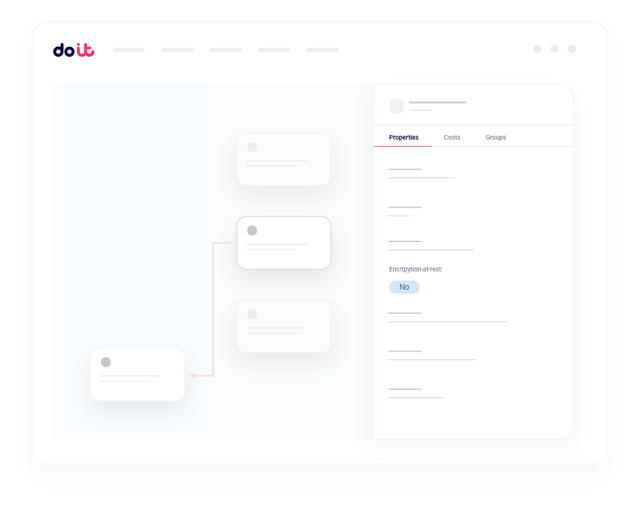
Cost and security context integration
Displays resource costs and highlights security risks directly in diagrams so decisions have full context.
Dependency tracking
Shows exactly how services connect so you know what gets impacted before you change something.
Optimize infrastructure without breaking dependencies
Cost tools show potential savings but not what breaks if you change something. Cloud Diagrams reveals exactly what connects to expensive resources so you can optimize with confidence.
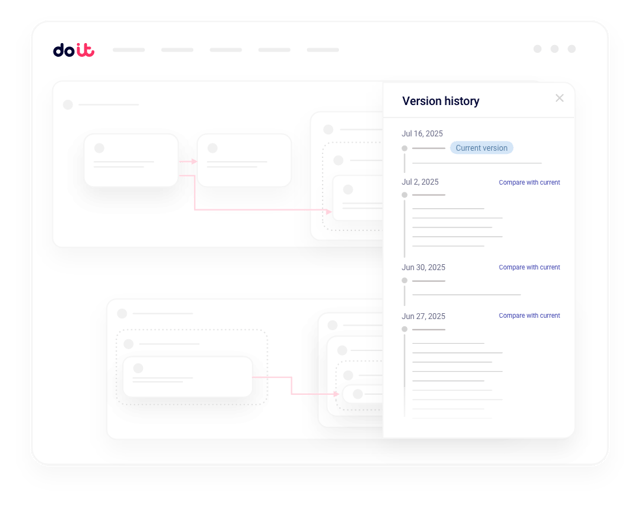
Documentation that updates itself automatically
Infrastructure documentation becomes obsolete the moment you deploy. Cloud Diagrams automatically reflects every change so your team always sees current architecture. No more stale wiki pages.
Troubleshoot network issues across VPCs, regions, and accounts
Network problems spanning multiple VPCs and regions take hours to diagnose. Cloud Diagrams maps network flows across your entire environment so you can trace connectivity issues immediately.
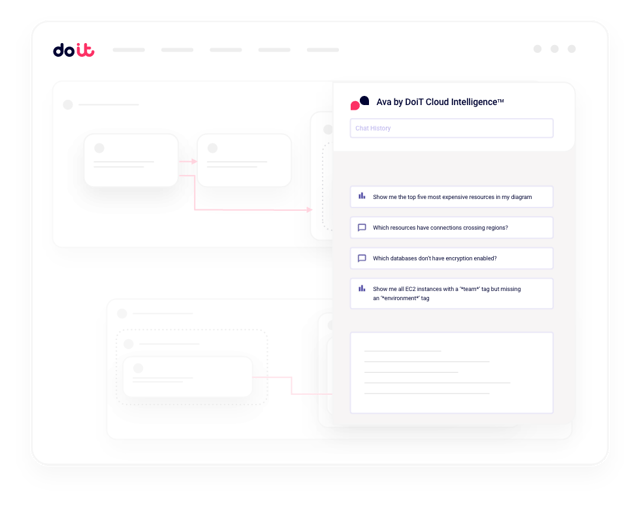
Query your infrastructure with built-in AI
Ask questions like "Which services have connections crossing region boundaries?" or "Show nodes where costs increased by more than 20% last month." Results appear highlighted in real time with cost, security, and architectural context.
Visualize multicloud connections in one unified view
Multicloud environments force teams to switch between consoles and mental models. Cloud Diagrams provides consistent visualization across AWS and Google Cloud so you see your entire infrastructure landscape in one place.
The problem
When teams need infrastructure context, it's nowhere to be found
As cloud environments grow, the architectural context teams need for critical decisions becomes scattered, outdated, or lost entirely.

Critical minutes lost during incidents
When production breaks, engineers scramble between outdated documentation and endless console tabs trying to understand how services connect.

New engineers take months to become productive
Without current architectural context, new team members piece together infrastructure understanding from scattered wiki pages and static, years-old diagrams.

Cost decisions made without architectural context
Teams make conservative optimization choices or delay cost-saving changes because piecing together resource dependencies requires navigating multiple cloud console screens.
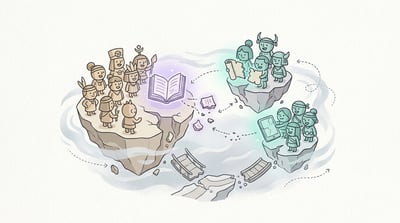
Knowledge becomes tribal and fragmented
Critical infrastructure understanding lives in individual team members' heads. When key people leave or go on vacation, it creates single points of failure.
Frequently asked
questions
Which cloud providers does Cloud Diagrams support?
Cloud Diagrams currently supports AWS and Google Cloud, with consistent visualization across both providers in a single unified view.
How often are the diagrams updated?
Cloud Diagrams continuously scans your cloud resources and reflects infrastructure changes in near real time. No manual updates or scheduled syncs required.
Can I see cost data directly in the diagrams?
Yes. Cloud Diagrams integrates cost data, security context, and dependency relationships directly into the infrastructure visualization so you can make informed decisions without switching tools.
Do I need to install agents or configure anything in my cloud accounts?
Cloud Diagrams works through read-only API access to your cloud accounts. There are no agents to install or infrastructure to manage.
How does the AI query feature work?
You can ask natural language questions about your infrastructure, like "Which services have cross-region connections?" or "Show nodes where costs increased by more than 20% last month." Results are highlighted directly in the diagram with full context.
See your cloud infrastructure the way it actually looks right now
Cloud Diagrams gives your team the live architectural context they need for faster incident response, confident optimization, and better decisions.