
How it works
One platform, every cloud, zero prep work
Cloud Analytics ingests billing data from AWS, Azure, and Google Cloud. It normalizes usage, enriches it with business context, and makes it explorable from high-level trends to line-item details.
Fully automated data ingestion
Pull in billing data from all major clouds. No setup, pipelines, or prep work required.
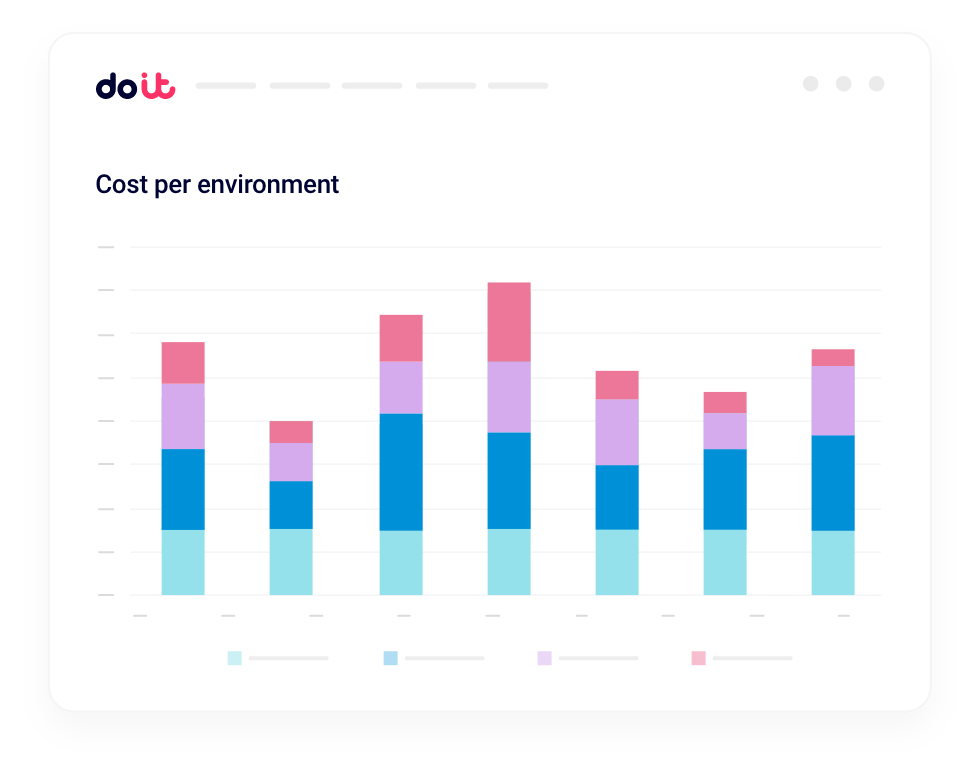
Built-in business context
Enrich cloud spend with teams, environments, products, or custom scopes using Allocations and DataHub.
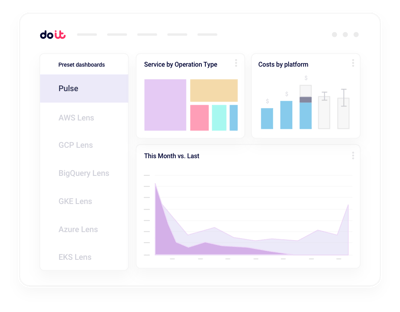
Dashboards built for FinOps
Pre-configured dashboards for forecasting, anomaly detection, and commitment efficiency. Ready on day one.
Seamless collaboration
Share filtered views with stakeholders or embed dashboards into tools your teams already use.
Integrated with your entire tech-stack
Works natively with your cloud providers, data platforms, DevOps and SecOps tooling. Custom integrations are available on-request.
ExploreCapabilities
Clarity, control, and confidence in your cloud spend
Cloud Analytics combines granular filtering, smart visualizations, and built-in business context to uncover what's really driving spend.
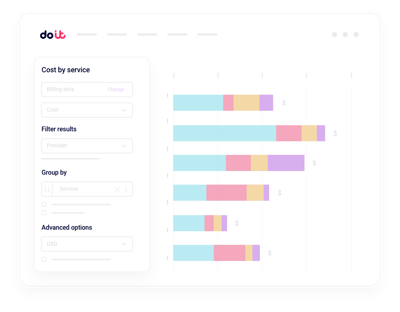
Deep, flexible filtering
Slice data by service, account, label, or SKU. No SQL needed.
Context-rich FinOps dashboards
Pre-built for anomaly detection, commitment efficiency, and team ownership.
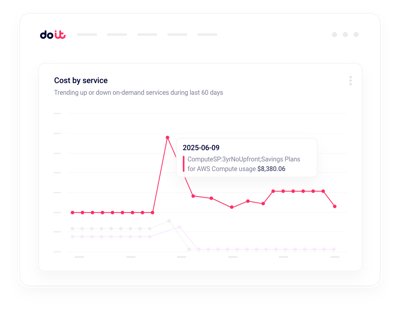
Real-time anomaly investigation
Catch unexpected spend changes fast. Drill down to root cause instantly.
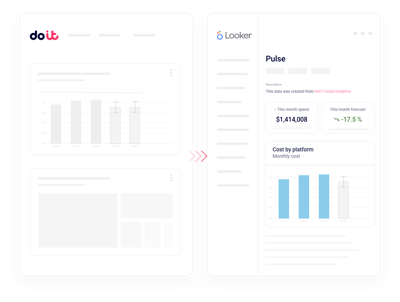
Seamless team handoff
Embed views into Grafana, Looker, or Sheets. Share in one click.
Zero data prep
No formatting exports, matching SKUs, or reconciling views between clouds.
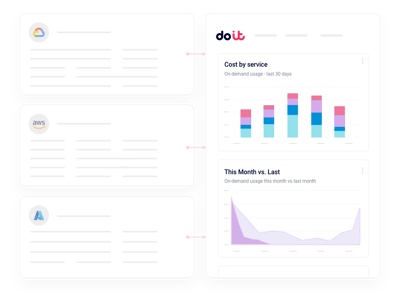
Multicloud single pane
AWS, Azure, and Google Cloud billing unified in one trusted view.
The problem
You can't optimize what you can't see
Cloud bills are dense, inconsistent, and disconnected from how your organization operates. Finance and engineering lack a shared view of what's being spent, by whom, and why.
Without a central source of truth, teams struggle to understand cost drivers across accounts, projects, and SKUs. Bills are grouped by account or tag, not by product or team. And when spend spikes, most teams lack the tools to isolate the cause quickly.
Problems Cloud Analytics solves
FinOps teams struggle with native tools

Minutes to investigate anomalies (down from hours)
Cloud providers unified in a single view
Times more likely to achieve business outcomes
Cloud Analytics isn't just a tool, it actually fits into how we work. We get real-time visibility into costs, and when something's off, we know immediately. Sometimes it's a bug, sometimes a usage shift, either way, it's something we can act on fast. That kind of feedback loop has made a real difference for both our engineering and finance teams.
Artem Nikulchenko, Chief Software Architect at Teamwork Commerce
See Cloud Analytics in action
Schedule a 15-minute demo with our team.